Notice that prices have been consolidating in a triangle pattern for the last two months. Yesterday we saw prices move through resistance on solid volume.
On the 2 year chart, notice that prices consolidated twice in 2007. The first consolidation occurred in March to September while the second occurred in October to November.
I use gold as a proxy for inflation expectations. In that vein, consider these long term charts.
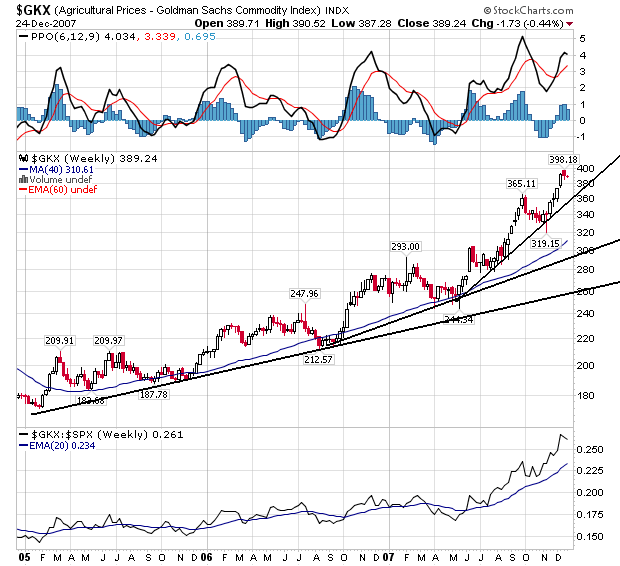
Agricultural prices are in a three year uptrend.
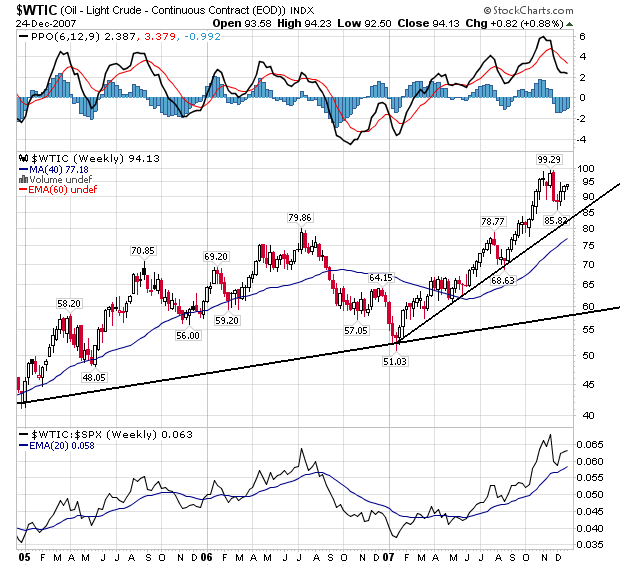
Oil prices are in a two year uptrend.
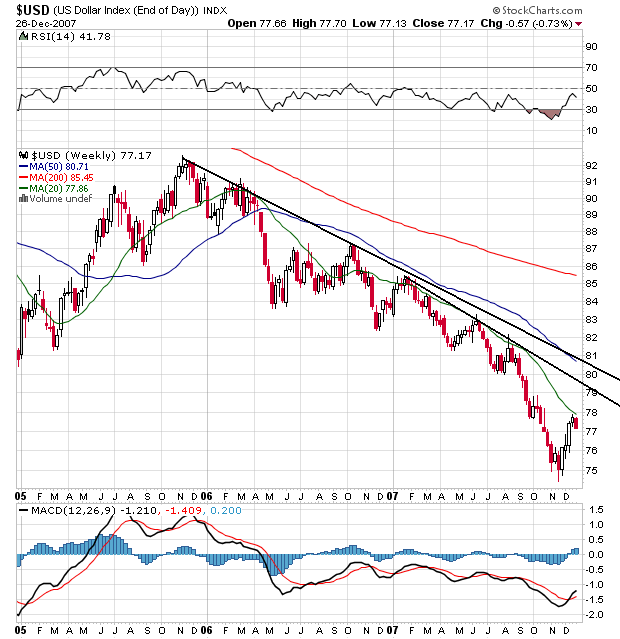
While the dollar has enjoyed a technical bounce over the last few weeks, it is still firmly in a downtrend.
The bottom line is prices are picking up across a variety of commodities. This is a demand driven situation -- 2 billion more people from India and China and living better. This was bound to happen sooner or later. Now we have to figure out how to deal with this development.