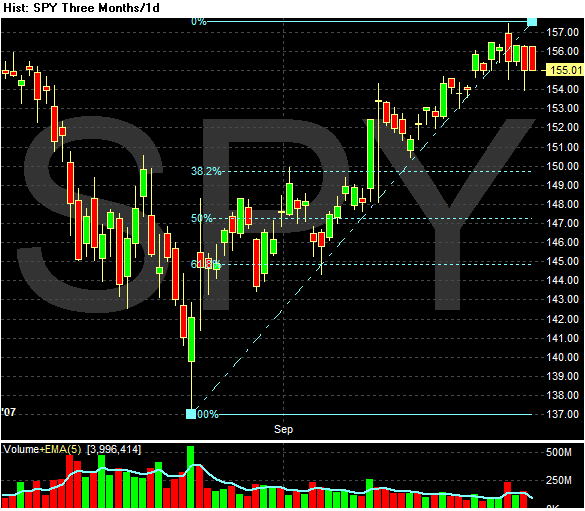
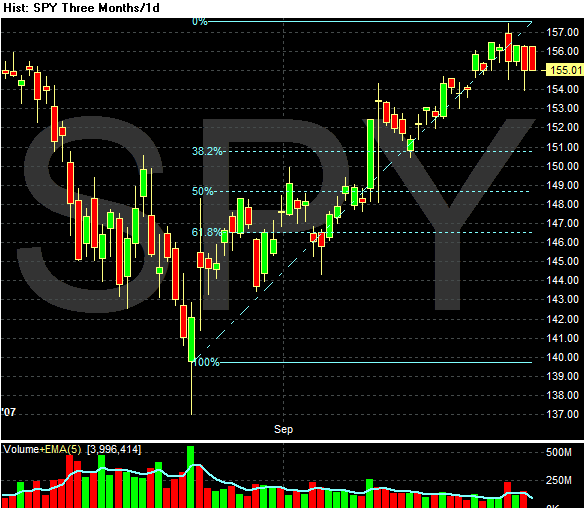
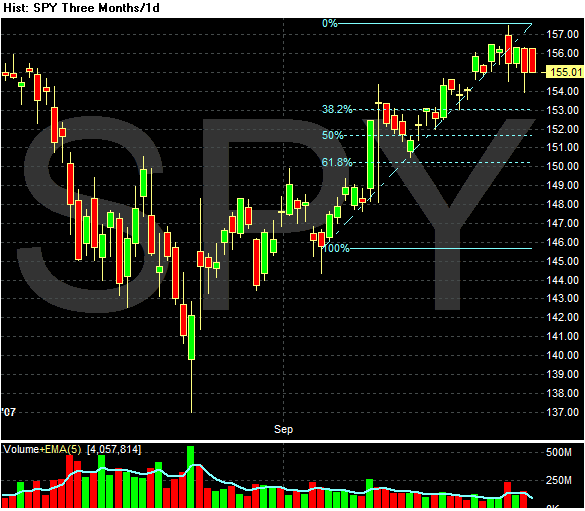
Assuming the double top thesis of the SPYs, let's look at retracement levels. Here are three charts that show possible Fibonacci levels. These are levels that traders will be looking at as possible reversal or stabilization levels if the the market continues to retreat.


