Schabaker wrote a book titled Technical Analysis and Stock Market Profits. In this book he devotes a chapter to trend lines. He is the first author who advanced the idea that a trend line can shift and change. The current SPY chart is a good example of this situation.
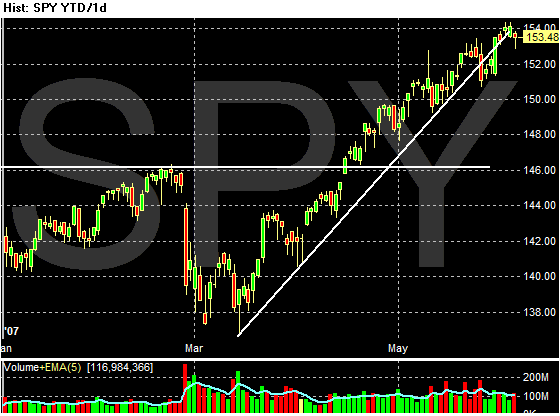
Here's one chart of the SPY with a trend line.

The main trend line on this chart makes perfect sense. It runs from a low point connecting various lows and provides a base for the SPYs advance. However, with this trend line the current rally has clearly broken through support, indicating a market reversal.
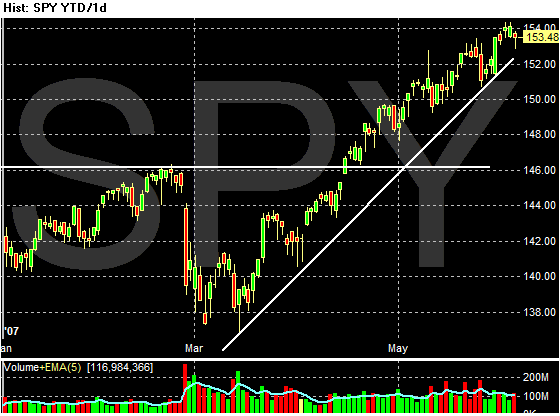
Now here's a second chart.

In this chart, the trend line has shifted a bit to the left. This trend line also makes sense, although it connects fewer lows on the upward advance.
Now the question becomes which trend line is right?
For that there is no clear answer. And there are arguments for both for and against a shifting of the trend line. The first trend line makes sense because the rally is a bit long in the tooth, especially for an economy that is slowing down. However, the second trend line makes sense for those who are arguing business investment is picking up and consumer spending is still strong.
What this really means is for those who are long in the market, it is a time to extra-vigilant watching your long positions.