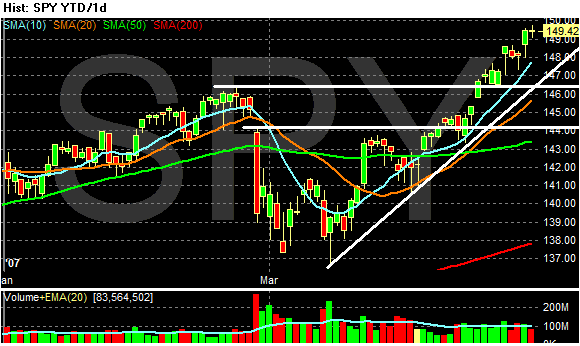
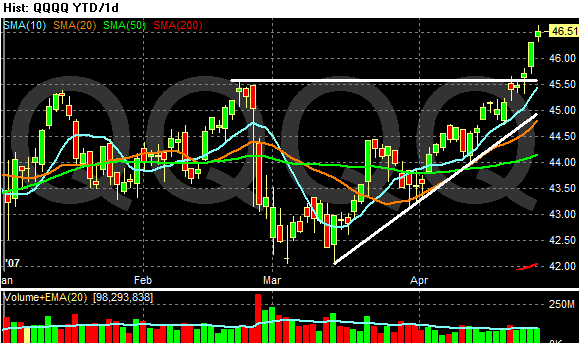
First, here is a chart of the SPYs and QQQQs. Both markets have a very nice uptrend in place. It's not too steep and not too shallow. W.D. Gann -- one of the greatest traders the market has ever seen, hypothesized a 45 degree angle is about right for the markets. These rallies are along that line.
In addition, the 10 and 20 day simple moving averages are trending up and each index is above the SMAs. So long as prices continue up, they will continue to pull the SMAs up. Also note the 10 and 20 day SMAs are above the 50-day SMA, which means the shorter-term averages will pull the longer averages up.
In short, these are bull charts from the daily perspective.


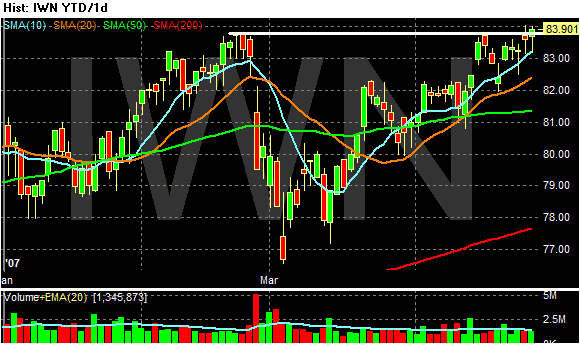
The IWNs are a little different. While they share many of the same bullish characteristics of the SPYs and QQQQs, they differ in one key area. Price wise, they are having a difficult time rising over resistance. Traders are hesitant to take this average higher.
The WSJs market beat blog has done a fair amount of writing on what it calls megacaps -- stocks with very large market capitalizations. These stocks have performed well from an earnings perspective and are considered safer as well. The IWNs difficulty getting over resistance may be a sign of a flight to quality -- traders looking for more secure names.
