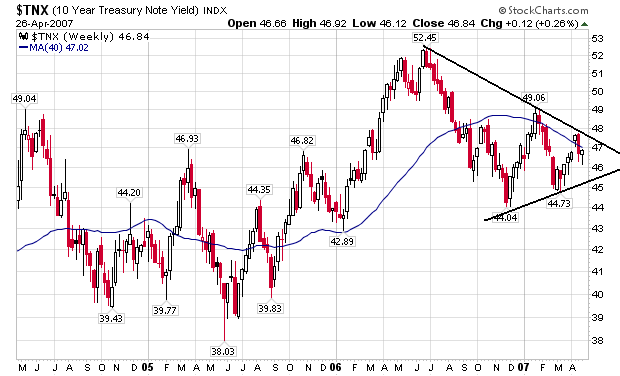
There are two trends on this chart.
1.) Since interest rates hit 5.25% in early July 2006, rates have headed lower. Remember that Treasury prices and yields move inversely, so this means traders have been buying treasury bonds. This means there is at least a diminished fear of continued inflationary pressure.
2.) At the same time, there is an upward move in yields that started in November of last year. That means that traders are selling at an interest rate of about 4.4%.
Putting these two trends together and we get a classic consolidation triangle. All this means is there is a tug-of-war going on in the market between bullish and bearish sentiment.