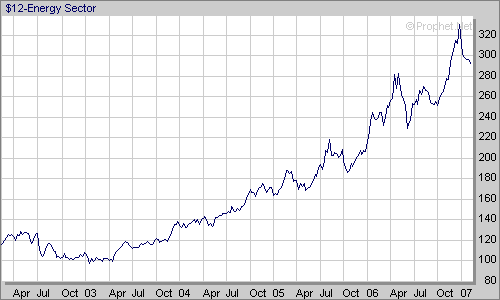
Notice how the sector has sold-off from the highs of late last year. This may be the type of blow-off the industry needed to clear out the dead weight. The index has pulled back to within the Fibonacci retracement levels (roughly between 38% and 62% of the preceding rally).
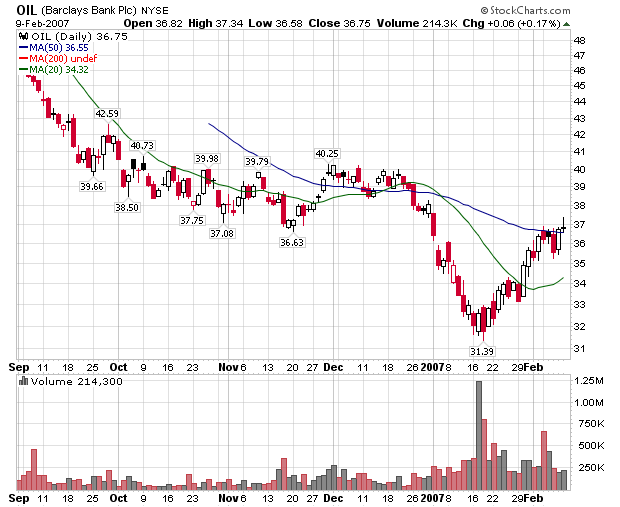
Here's a chart of oil -- actually the OIL tracking stock.

A break-out about $60/bbl for oil or $37 on the chart could signal a new upswing. If that happens, oil will become more profitable making the energy sector more attractive.
This strategy is based on oil. So wait for oil to move above resistance by at least 2-3%.