Saturday, July 17, 2021

Weekly Indicators for July 12 - 16 at Seeking Alpha


 - by New Deal democrat

My “Weekly Indicators” post is up at Seeking Alpha.

All timeframes continue positive, but the renewed outbreak of COVID - indeed, its uncontrolled exponential spread - is the proverbial elephant in the room, and is quite likely to Bigfoot the entire forecast and nowcast. And with the many crosscurrents, is effect on the economy is fiendishly difficult to forecast.

As usual, clicking over and reading should be rewarding for you, and for me as well to the tune of a penny or two.

Friday, July 16, 2021

June retail sales decline after taking inflation into account, but overall pandemic gains “stick”


 - by New Deal democrat

As usual, retail sales is one of my favorite indicators, because it gives us so much information about the consumer economy. 

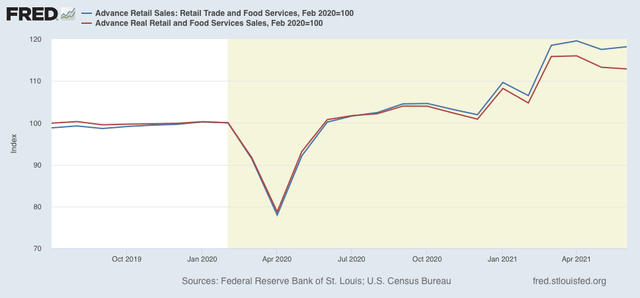
The news for June was mixed. Nominally retail sales were up +0.6% for the month. But after taking into account consumer inflation, real retail sales declined -0.3%. Still, nominal retail sales are up over 18% since just before the pandemic started, and up +12.9% taking into account inflation:


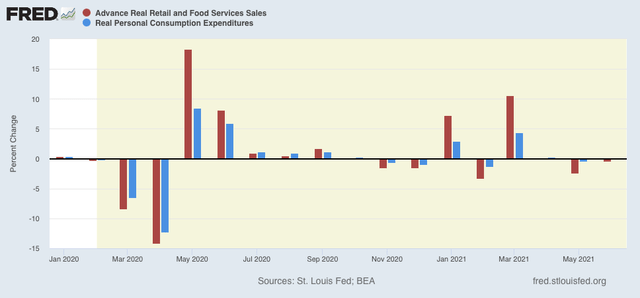
Here’s what the monthly changes in real retail sales look like compared with the other side of the consumer ledger, real personal consumption expenditures (which haven’t been reported for June yet):


The two have moved pretty much in tandem, so this gives me more confidence in the numbers.

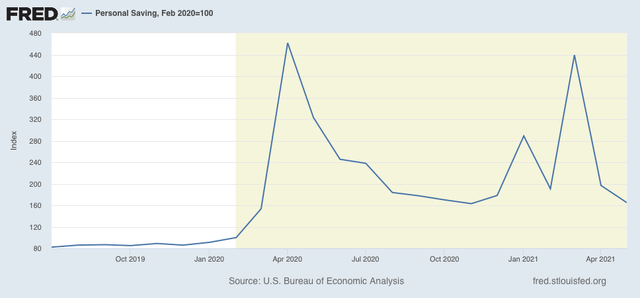
But what is going to happen when the pandemic stimulus ends in a couple of months?  This is a legitimate concern, if spending is suddenly going to crash. The good news there is, even with recent drawdowns, consumers have increased their personal savings by 65%, or just over $900 Billion since the pandemic started:


This cash, which essentially is being held in reserve, should help cushion consumers, at least in the aggregate, when supplemental payments run out. And the enhanced Biden child tax credit, which is sending checks to millions of American families starting this month, is also going to help immensely.

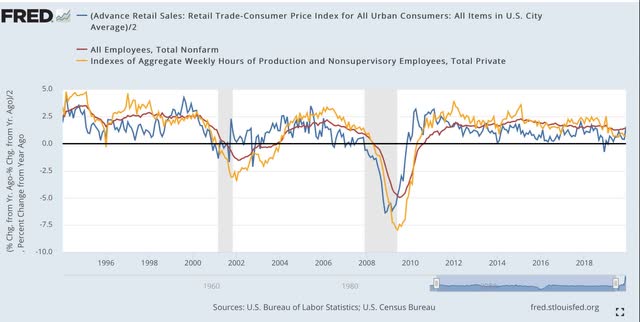
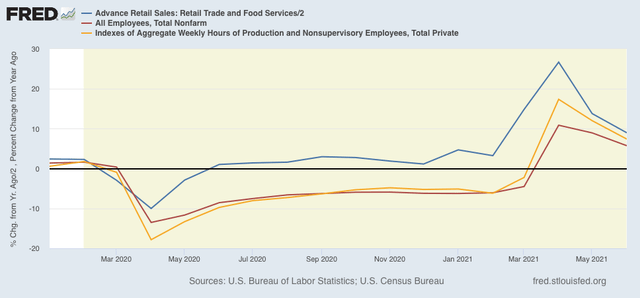
Next let’s turn to employment, because as I have pointed out many times, real retail sales (blue) tend to lead employment (red) and aggregate hours (gold) by about 3-4 months. Here’s the long term YoY look from 1993 through the end of 2019:


The long lags after the 2001 and 2008 recessions reflected the “China shock” as manufacturing jobs in particular were re-sourced to China in large wages after both recessions.

Here is the monthly update since the beginning of 2020 (note the huge difference in scale!):


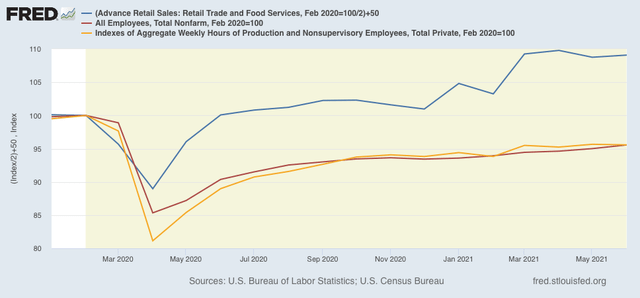
Since it is hardly surprising that there has been a big YoY jump in jobs in the past few months, given the 22 million loss in jobs in April 2020, the below graph compares the absolute data, normed to 100 as of February 2020 (with an adjustment for the increased volatility of retail sales compared with employment):


We had another big positive month for jobs (+850,000) in June, and the above graph argues that there is more to come. The biggest reasons that there hasn’t been even better numbers are (1) the supply bottlenecks in important industries like autos and home construction; and (2) continuing issues with things like arranging child care, and continued fear of the pandemic.


Thursday, July 15, 2021

Jobless claims make new pandemic lows; but the virus is back in control


 - by New Deal democrat

New jobless claims are the most important weekly economic datapoint with regard to the effects of vaccination progress. At this point, it is also a test of how much the “delta wave” of new cases is setting economic progress back. Two weeks I wrote that, because progress in vaccinations had largely stalled, “that implies at least a stall in the decline in new claims, and - I actually suspect - an increase, perhaps to about 450,000 per week or so.”

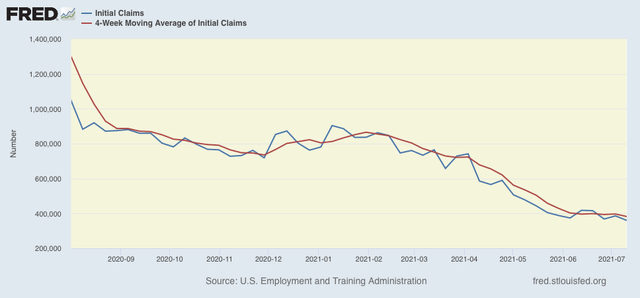
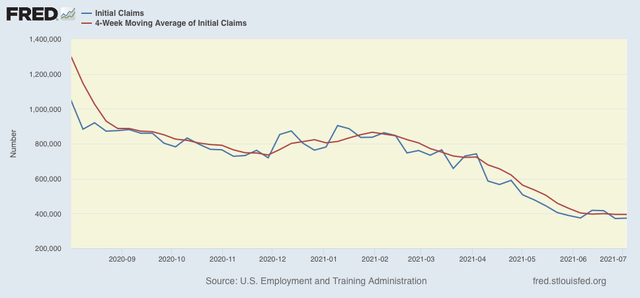
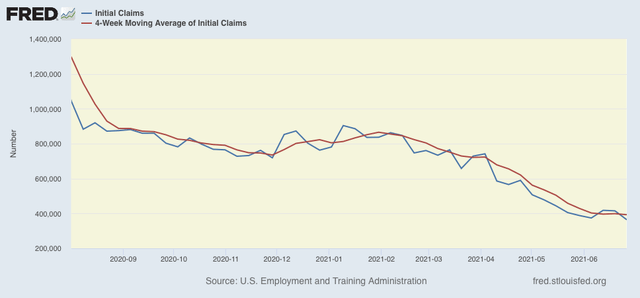
That certainly didn’t happen, at least this week. New jobless claims declined by 26,000 to 360,000, a new pandemic low. The 4 week average of claims set a new pandemic low, declining by 14,500 to 382,500. Here is the trend since last August:


After peaking last year at roughly 7 million, claims declined sharply into winter, then rose again during the winter wave of infections. This year, from late February into May, claims had trended down an average of roughly 100,000 per month. This has slowed sharply since then, to a decline of only about 20,000 in the past 5 weeks in the 4 week average.

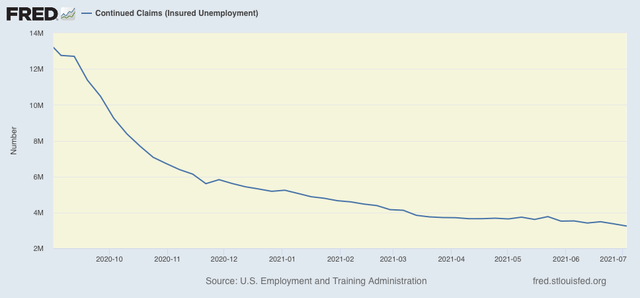
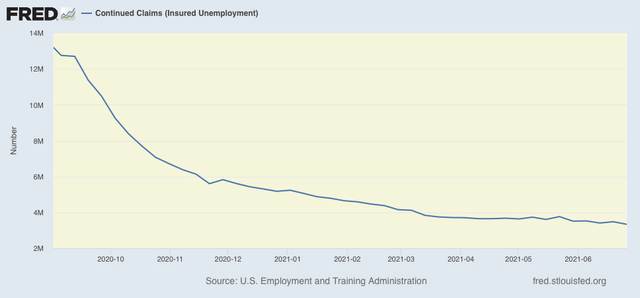
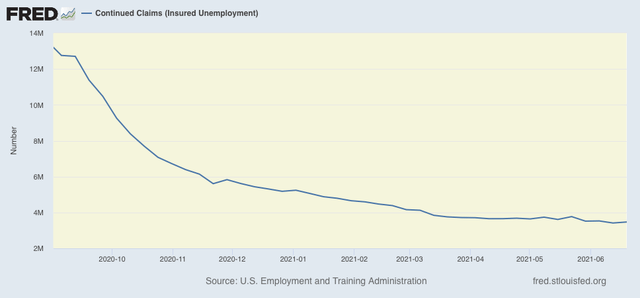
Continuing claims, which are reported with a one week lag, and lag the trend of initial claims typically by a few weeks to several months, have declined gradually about 15% from roughly 3,800,000 over the past 4 months, and also set another new pandemic low today at 3,241,000:


Some of this decline *may* be due to many States’ termination of all extended jobless benefits due to the pandemic.

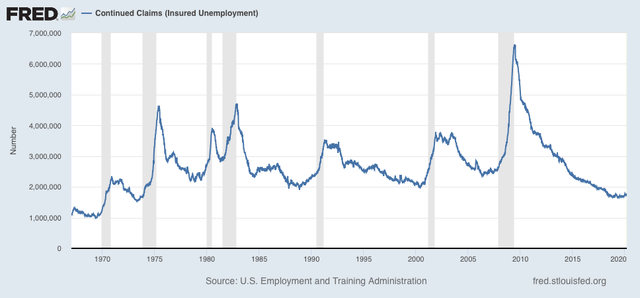
A long term perspective shows that this week’s level is similar to early during other recoveries from most previous recessions, versus at 2,000,000 or below later in strong expansions:


My ultimate target for economic success from vaccinations has been for claims to average 325,000 or below. 

But at this point nearly all States are showing an increase in new cases, and overall the average daily count of new COVID cases has more than doubled from 11,300 to 25,255 in the past 22 days. Deaths have also started to increase again. Thus the virus is back in control, especially in the relatively unvaccinated States. How employers and potential customers will behave in response to that is very much open to question, and so I am skeptical that there will be a full return to employment until the disease has run its course.

Industrial production slightly positive overall, but with negative revisions


 - by New Deal democrat

Industrial production is the King of Coincident Indicators. It is the single datum that most frequently coincides with the NBER determination of the beginning and end of recessions.


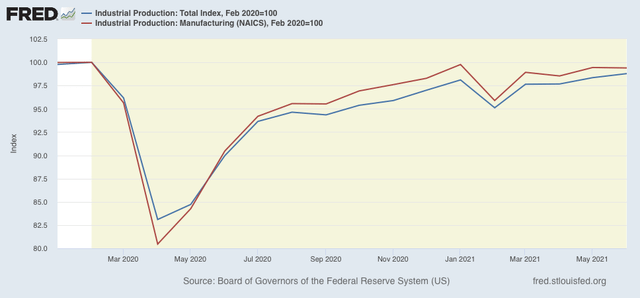
Production increased 0.4% in June, but May’s result was reduced by -0.2%. The manufacturing component declined less than -0.1%, and May’s result was also reduced, by -0.3%. As a result, overall manufacturing remains 1.2% below its pre-pandemic level, and the manufacturing component is -0.2% below that level:


While this wasn’t a poor report, it was only weakly positive overall. I don’t think the NBER will feel comfortable declaring the COVID recession over until at least the manufacturing component is all the way back to February 2020 levels.

Wednesday, July 14, 2021

Real wages decrease sharply - at least, if you include used vehicle prices


 - by New Deal democrat

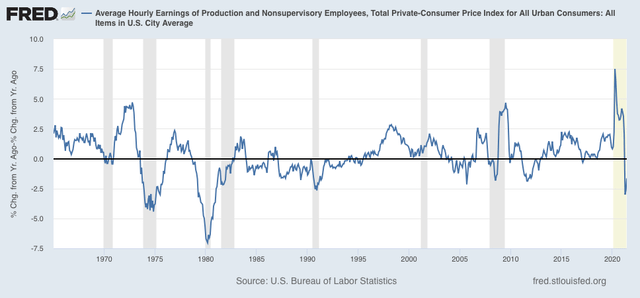
As I pointed out yesterday, the big increase in inflation over the past few months has made the YoY change in real wages for nonsupervisory workers negative. Let’s take a little closer look.


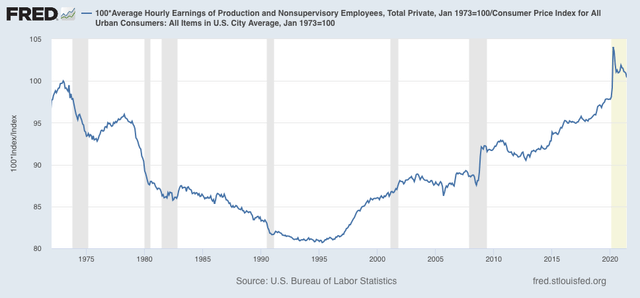
Here is a graph of wages for nonsupervisory workers taking overall inflation into account, normed to 100 as of January 1973 (its peak previous to the pandemic):


Wages had been gradually increasing in real terms for several decades before the pandemic. The big surge in spring 2020 was due to the massive layoffs in the low wage sectors of the economy. Much of the decline since then has been attributable to their being rehired.

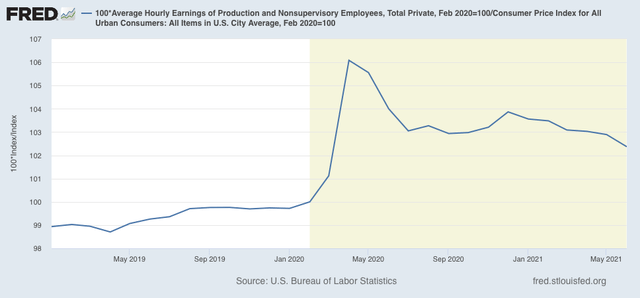
Here is a close-up over the past 2 years:


Average wages are still 2.4% higher than before the pandemic.

The same data YoY shows a decline of -3.9%:


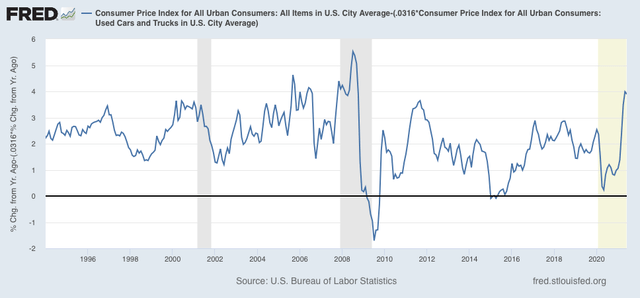
But when we take used vehicles out of the inflation equation, YoY inflation is less explosive than the total number appears, at +3.9%:


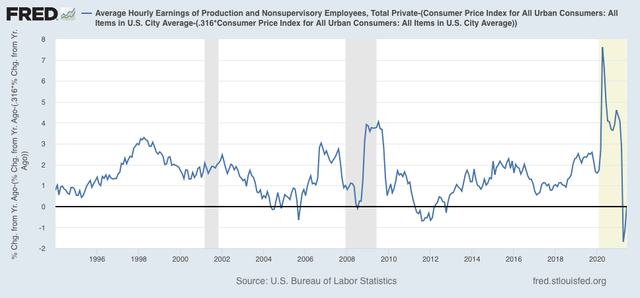
So now here is the YoY% change in wages, leaving out used vehicles:


If you’re not in the market for a used vehicle, YoY real wages have risen ever so slightly (less than 0.1%).

I do expect the issue with vehicle prices to work itself out as microchips for vehicle manufacture become more available, but I have no insight as to how short or long a period of time that will be.

And of course, if you are looking to buy a house as well, you are really up the creek without a paddle.
 

Tuesday, July 13, 2021

Consumer inflation rises the most in over a decade; will it draw the Fed’s attention?


 - by New Deal democrat

Let me start my take on this month’s inflation report with my concluding remarks last month: “this is not a big deal if it only lasts another month or two. But if the trend continues longer than that, it will begin to impact consumer spending, and it will get the Fed’s attention.”

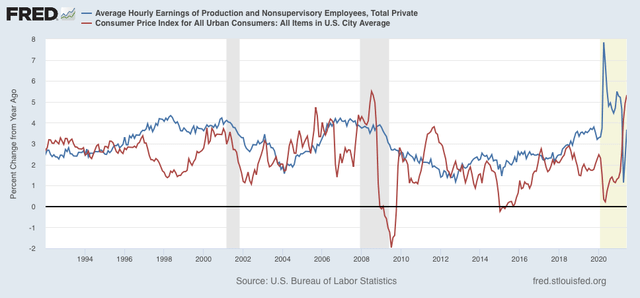
Well, it has definitely lasted another month. In spades.  The 0.9% increase in June was the highest since June 2008’s 1.0% increase (driven by $4+ gas).(red in the graph below) More importantly, the 5.3% YoY increase is also the highest since summer 2008, and well in excess of the YoY average wage increase for nonsupervisory workers of 3.7% (blue):
This is going to get the Fed’s attention. They may not even wait another month.

Be that as it may, the primary driver of this inflation is not wage increases, it is first and foremost a supply bottleneck in the production of new cars, which is driving insane demand for used cars (blue in the graph below), the prices of which are up 45.2% YoY. Secondarily it is the demand driven increase in gas usage, which has caused those prices to increase 44.8% YoY (red):
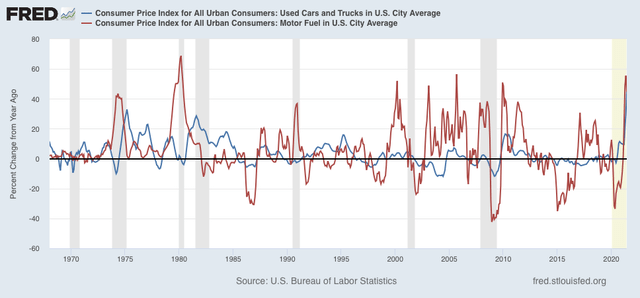
The spike in prices in used cars alone is responsible for about 1/3 of the total increase in prices last month. Used car prices, which are about 3.2% of the total weighting in the inflation index, rose 10.8% in just the past month! That nets out to over 0.3% of the total inflation number being just used cars.

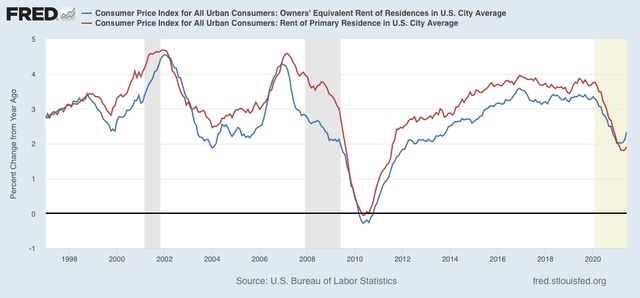
On the other hand, rent continues to be somnolent (as is “owners’ equivalent rent,” which is how the Census Bureau tries to measure house prices):
By the way, ultimately the house price spike has been driven by the fact that during the pandemic last year, existing homes placed on the market (which are about 90% of the typical housing market) declined precipitously compared with the typical year:
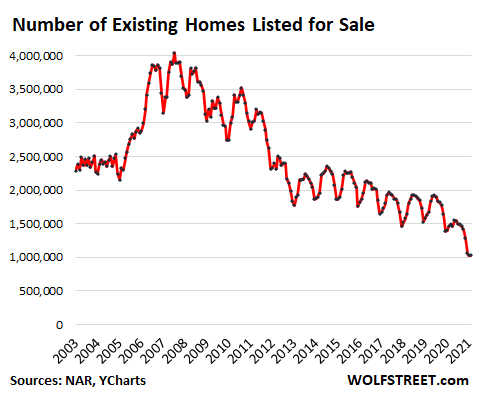
I expect both house prices and gas prices to work themselves out. Not only have home sales declined, but I expect most of the houses that were going to be placed on the market in 2020 to go to market over the next 12 to 24 months. This surge in existing home inventory is going to drive house prices down. Similarly, the travel bug from being cooped up at home during the pandemic is going to pass as well.

That leaves motor vehicles. As I wrote last month, I have no special insight into vehicle part supply chains, and in particular microchips, which have been fingered as a primary shortage.

But, hypothetically, would the Fed raising rates do anything about that shortage? The answer seems a pretty clear “NO,” so why deliberately slow down the rest of the economy to deal with a bottleneck that is beyond their control?

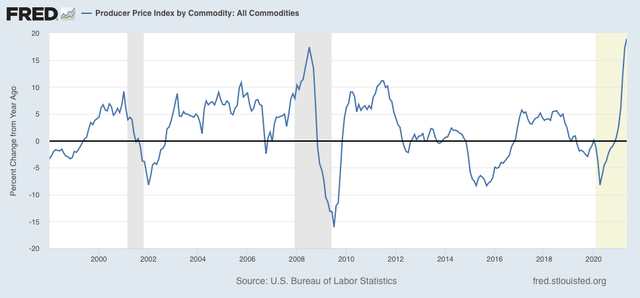
Beyond that, as I wrote last month, there have been a number of 10%+ spikes in commodity prices in the past several decades that were brief in nature and worked themselves out without causing a recession:

Ironically, the only way I can see the Fed “helping out” with inflation, is in the area of their “blind spot” - actual house prices. If they were to raise rates just enough to trigger an increase in mortgage rates of 0.5%-0.75%, which would serve to cool down the housing market in a very substantial way without necessarily causing the economy as a whole to stall.

Monday, July 12, 2021

Coronavirus dashboard for July 12: the completely preventable “delta wave” is here


 - by New Deal democrat

The completely unnecessary and preventable “delta wave” of COVID infections, hospitalizations, and deaths is now in force - all three metrics are now rising nationwide.


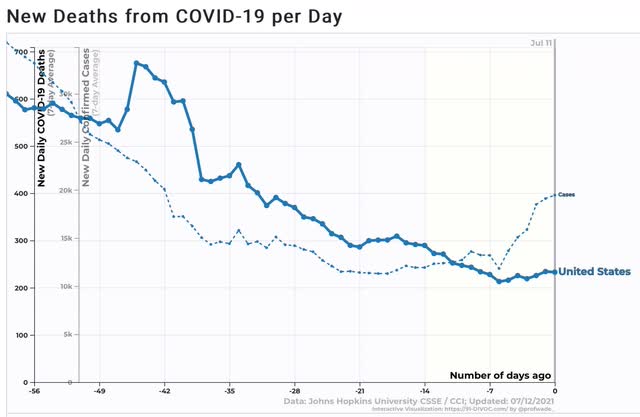
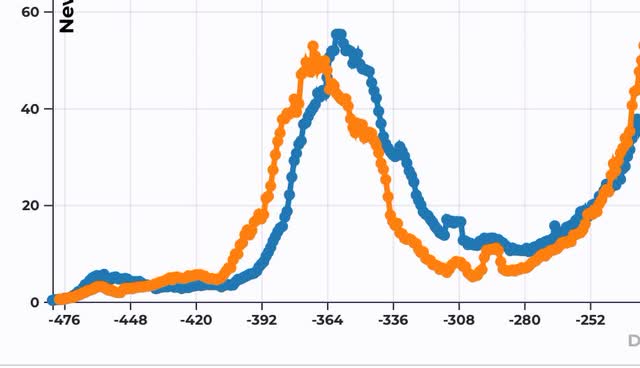
Here are the 7 day average of confirmed cases (thin line) and deaths (thick):


Cases have gone up roughly 50% from their 11,300 trough 3 weeks ago. Deaths likely bottomed 7 days ago.

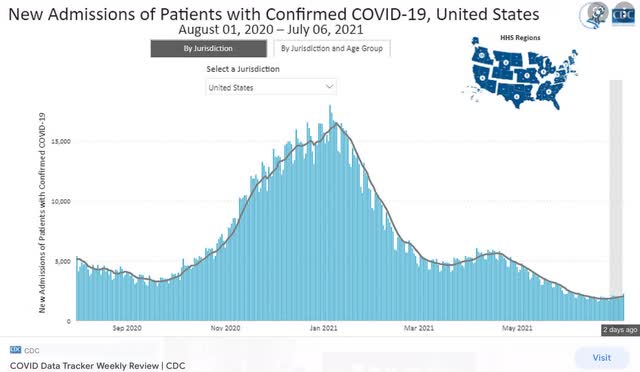
Hospitalizations (graph from the CDC) have also started rising in the past week or so:


There are July 4 artifacts in almost all the new data, which won’t pass out of the 7 day averages for several more days. Also, about half of the States have apparently decided that COVID is so “over” that they no longer need to report on the weekends. 

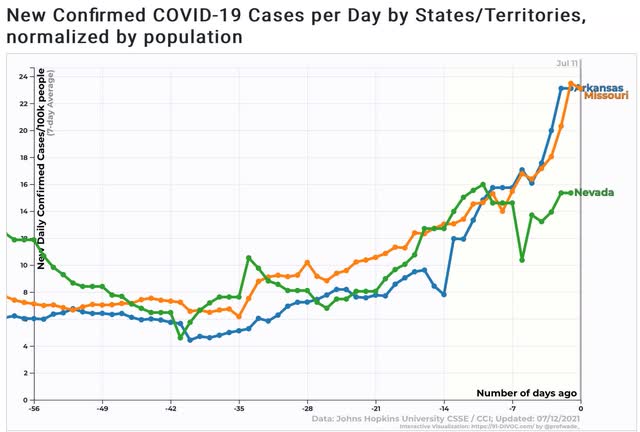
With those caveats, here are a few graphs of the worst-affected States.

Here are Arkansas, Missouri, and Nevada:


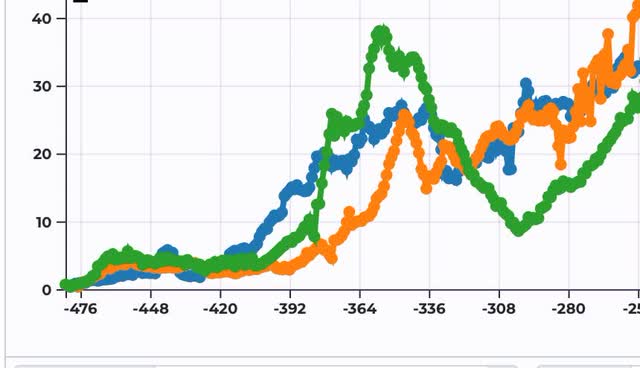
And here they are for spring and summer 2020 for comparison:


Arkansas and Missouri have already matched their worst summer 2020 levels. Nevada is at less than half of its worst levels.

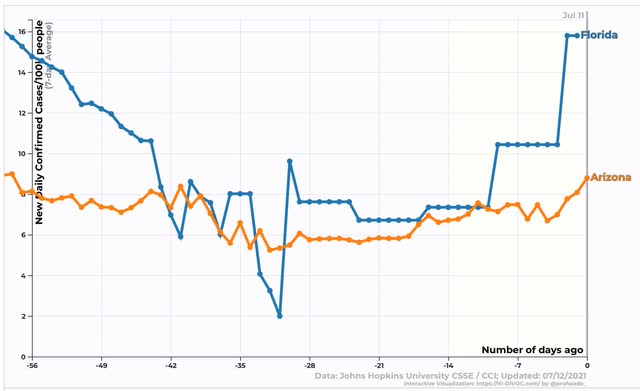
Next, here are Florida and Arizona, both of which had the worst summer outbreaks last year:


Here they are for comparison last year:


Florida is currently only at a little over 1/4 of its worst level from 2020, and Arizona is at about 1/6th of last year’s worst levels.

I expect the situation for all of the above States, except possibly Arizona, to change considerably for the worse before the end of this month.

All of which was completely preventable.

Saturday, July 10, 2021

Weekly Indicators for July 5 - 9 at Seeking Alpha


 - by New Deal democrat

My Weekly Indicators post is up at Seeking Alpha.

To the surprise of many, interest rates have gone down in the past few weeks, to the point where they have resumed being a positive in my long leading model.
Meanwhile, as the “delta wave” of COVID builds in the unvaccinated States, once again the pandemic will begin to assert control over the economy, at least as to those sections of the country, and may override the leading signals from the model.
As usual, clicking through and reading will bring you up to date, and bring me a penny or two for my efforts.

Friday, July 9, 2021

Scenes from last week’s June employment report


 - by New Deal democrat

With no significant economic data today, let’s take a look at some of the more salient numbers from the June employment report released one week ago.


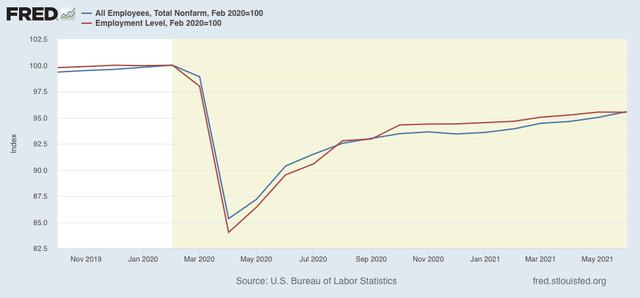
Starting with the headline employment numbers, both the Establishment Survey and the Household Survey, while diverging in any given month, are in close agreement about the extent of the comeback from the worst of the pandemic, down -4.4% and -4.5% from February 2020, respectively:


This is about a 70% recovery from the bottom.

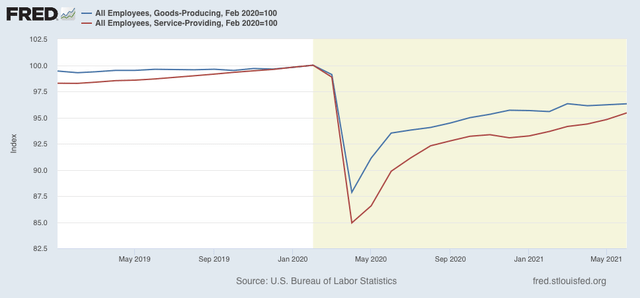
Comparing goods producing vs. service providing jobs, we see that the former are down -3.7% since February 2020, while the latter are down -4.6%:


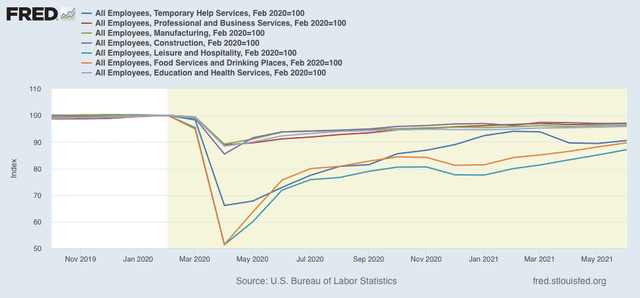
Breaking jobs down further, comparing the less affected sectors of construction, manufacturing, professional services and education and health services all show modest recoveries, while the more severely affected temporary help, leisure and hospitality, and food and drink sectors have recovered more strongly - but are still lagging:


Jobs in the leisure and hospitality sector are still down -12.9% since February 2020.

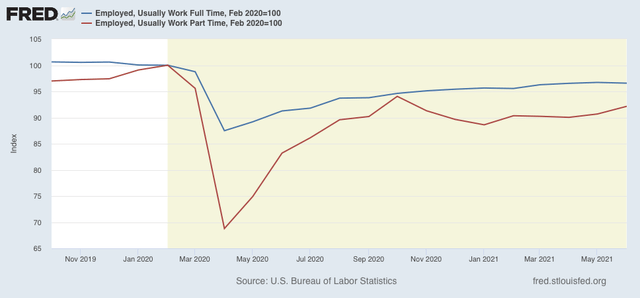
Turning to the household report, we see that those who usually work part time were by far the hardest hit, and while they have recovered considerably, still lag full-time workers:


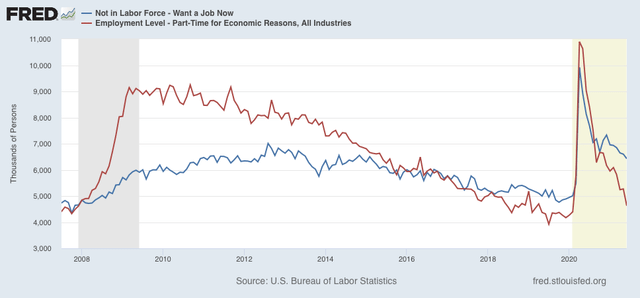
On the other hand, those who are working part time involuntarily (red in the graph below) have declined to near full-recovery levels. The number of those who are out of the labor force but want a job (blue) has declined, but is still near its previous record levels of 2012 and 2013:


This is about 2.5 million people who aren’t in the labor force at all, but would be in more normal times. It will take a further recovery of job prospects to draw them back into applying for jobs.

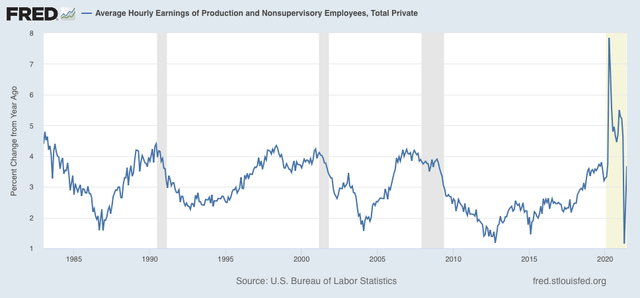
Finally, turning to pay, the YoY% gain for ordinary non-supervisory workers has risen back to 3.7%, which is in line with some of its best gains over the past 45 years:


This is good news since in the past few months many workers in typically low wage occupations have been rehired.

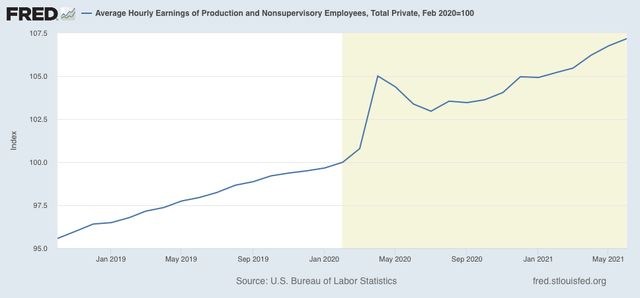
Another way of looking at this is comparing the 16 months just before the pandemic with the 16 months since. In the 16 months before the pandemic, wages rose 4.4% (or 3.3% annually). In the 16 months since, wages have risen 7.2% (or 5.4% annually):


Whether these kinds of gains will survive the further re-opening of the economy, particularly as emergency pandemic benefits end, is very much an open question.


Thursday, July 8, 2021

Trend in new jobless claims flattens: the virus remains in control in the unvaccinated States


 - by New Deal democrat

New jobless claims are the most important weekly economic datapoint with regard to the effects of vaccination progress. Four weeks ago I wrote, “I think we are going to see two tracks going forward from here, as near-normalcy does return to the more vaccinated parts of the country, while attempts to return to normalcy fail in the laggard regions.” Last week I elaborated to say, because progress in vaccinations had largely stalled in the past month, “that implies at least a stall in the decline in new claims, and - I actually suspect - an increase, perhaps to about 450,000 per week or so.”

This week showed evidence of continued progress, but only very slowly. New jobless claims increased by 2,000 from last week’s new pandemic low, to 373,000. The 4 week average of claims also declined by only 250 to a revised new pandemic low of 394,500. Here is the trend since last August:


At the peak of the pandemic lockdowns in spring 2020, new claims were running 6 million to 7 million per week. This year, from late February into May, claims had trended down an average of roughly 100,000 per month. This has slowed sharply over the last 4 weeks to a decline of only about 25,000. The less volatile 4 week average is only down 8,250 from 5 weeks ago.

Continuing claims, which are reported with a one week lag, and lag the trend of initial claims typically by a few weeks to several months, have only declined about 13% from roughly 3,800,000 over the past 4 months, reported today at 3,339,000 - which was, nevertheless, another new pandemic low:


At least some of this decline *may* be due to many States’ termination of all extended jobless benefits due to the pandemic.

A long term perspective shows that this week’s level is equivalent to early during the recoveries from most previous recessions, versus at 2,000,000 or below later in strong expansions:


My ultimate target for economic success from vaccinations is for claims to be an average of 325,000 or below, which would signify a return to normal expansion levels in the past 30 years. But with more than half of all States now showing increases in new cases, and deaths following in a few of them, the virus remains in control in those States - and how employers and potential customers will behave in response to that is very much open to question.

Wednesday, July 7, 2021

May JOLTS report continues to show a jobs market out of equilibrium


 - by New Deal democrat

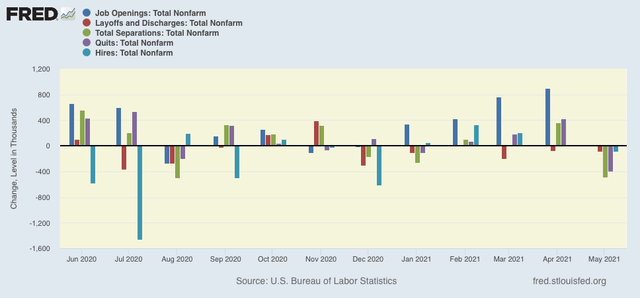
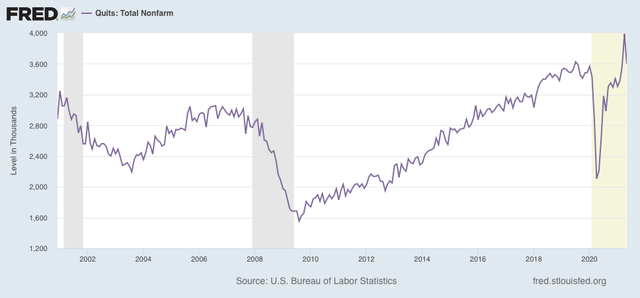
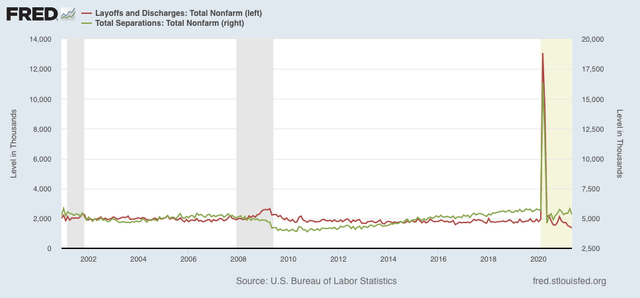
This morning’s JOLTS report for May continued all of the trends we saw in April - a huge amount of unfilled job openings, a comparatively weak level of actual hiring, an enhanced number of people quitting their jobs, and record low layoffs and discharges.

To begin with, on a month over month basis, all 4 of the metrics above, plus total separations, declined:


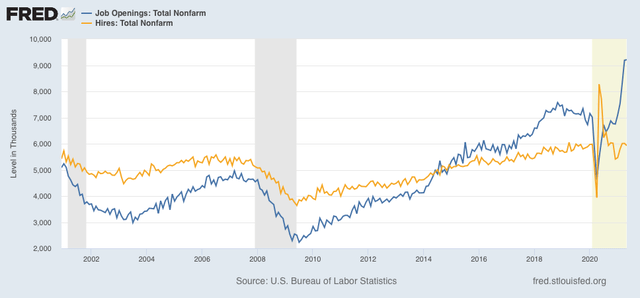
As noted above, headline job openings (blue) (which declined a slight -16,000) persisted at their record high levels over 20% above any prior reading, while hires (gold)  languished, relatively speaking, at normal levels:


Voluntary quits also declined from last month’s record high, but remained higher than any other prior month except for July 2019:


The record number of people voluntarily quitting their jobs (meaning they are not eligible for unemployment benefits) flouts the idea that job openings can’t be filled because of those benefits.

Finally, while total separations (green, right scale) are at normal levels, layoffs and discharges (red, left scale) declined to yet another all time low:


This is a market that is out of equilibrium. Almost nobody is getting laid off, but lots of people are quitting. There are record openings, but only a normal number of hires to fill those openings. The market will not get back into equilibrium until more people decide they want to fill those job openings. While undoubtedly for some of those people not entering the job market continued pandemic jobless benefits are an issue, for many more the lack of COVID safety in the locale where they live, the unavailability of reasonable-cost child care, or the general low pay for the labor required, are keeping them on the sidelines.

Tuesday, July 6, 2021

Coronavirus dashboard for July 6: bad news and *relatively* “good” news about the Delta Wave


 - by New Deal democrat

In the near future, there appears to be bad news and *relatively* “good” news for the US. The bad news is that the “delta wave” is spreading, and we should expect a real outbreak on the order of last summer’s by early August. The *relatively* “good” news is that the death rate is likely not to be nearly so bad, if the experience in the UK is any guide.

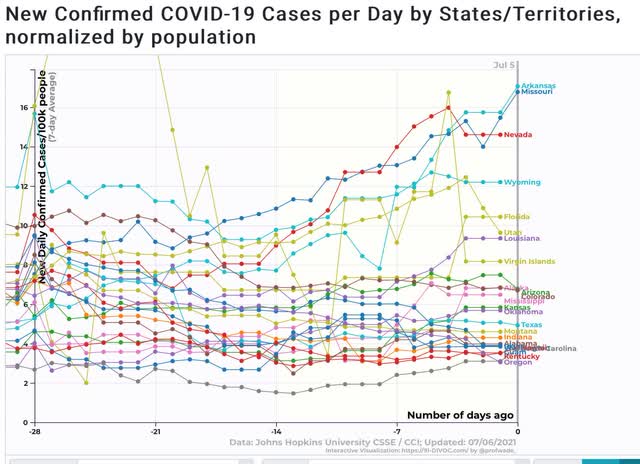
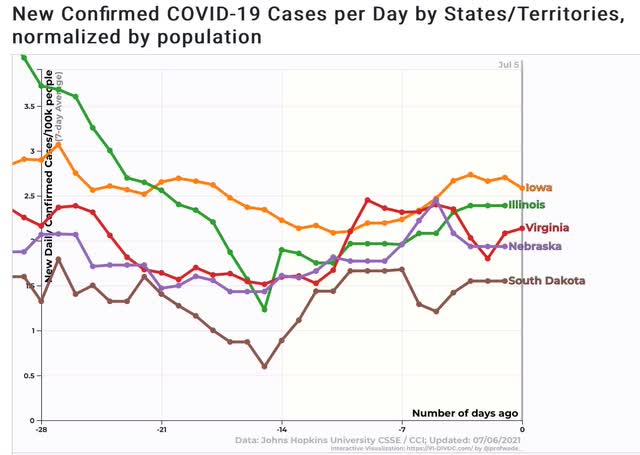
First, here’s the bad news, graphically. Of the 25 US States with the highest rate of infections, only 5 do not show an increase: declines in CO, NM, OR, and WA, and steady cases in DE:


Of the 25 States + DC with the lowest rate of infections, 5 have started to trend significantly higher:


In other words, the uptrend in new cases has spread to 1/2 of all US States so far.

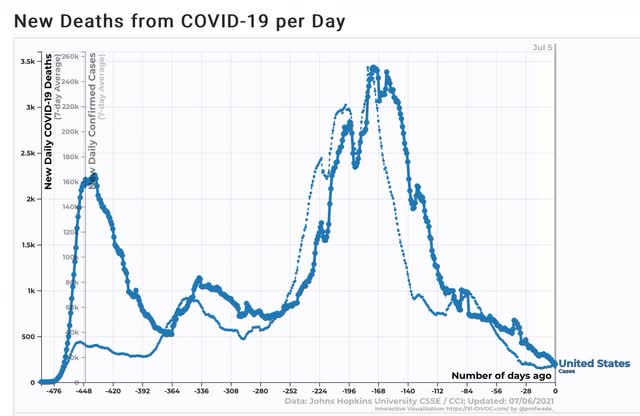
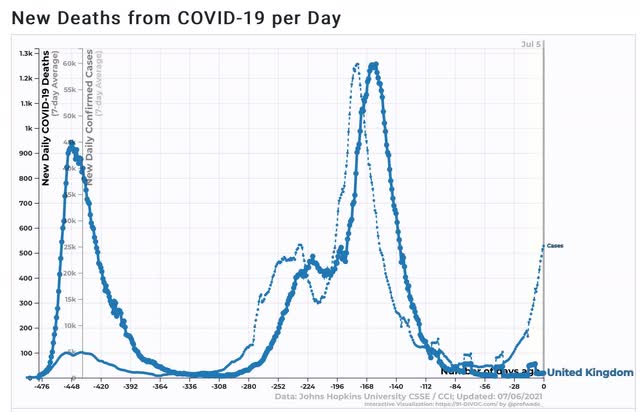
The *relatively* “good” news is founded on the experience of the UK with its “delta wave.” The U.K. experience is a bellwether for where the US is going to be in about 4 weeks. There, the outbreak is now the worst except for last winter’s, and has quintupled in that time. BUT, while deaths typically lag cases by 4 weeks, even a quintupling in the rate of deaths in the UK would put it at perhaps only 10% (!!!) of the level during the first wave of spring 2020:


Here is the same graph for the US as a whole:


If the US follows the same trajectory as the UK, the daily death count might “only” go up to about 600 or 700 cases by Labor Day or so, compared with 1000 or more during most of 2020.

Monday, July 5, 2021

No, liberals are not to blame for political polarization


 - by New Deal democrat

Over the long weekend, Kevin Drum picked a fight by saying that you should “blame liberals” for culture wars, arguing that liberals have shifted their positions much more over the past two decades than conservatives.

This has provoked some strong counter-arguments, but what has struck me - as usual - is how little people have actually looked at the data. When you do so, there are at least three very important contradictions or limitations to Drum’s argument.

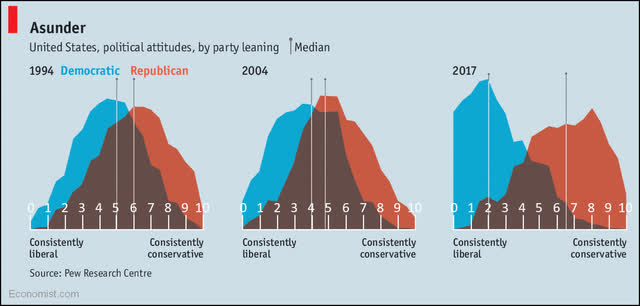
Drum’s decisive evidence is this graph from a 2018 report by the Pew Research Center on partisanship:


And indeed, Democrats have moved much further to the left than the median GOPer has to the right.

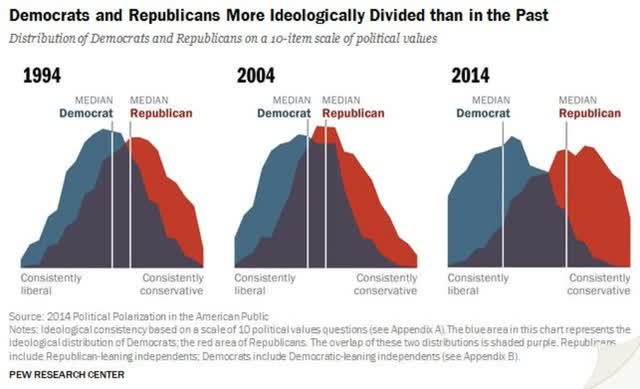
Except. Except he left out the fact that Pew did an identical study in 2014, and here’s what the same graph looked like then:


Oh. Notice that the differences aren’t nearly so asymmetrical in 2014 as they were in 2017. So what happened in between those two years that made Democrats more sharply break from the center?

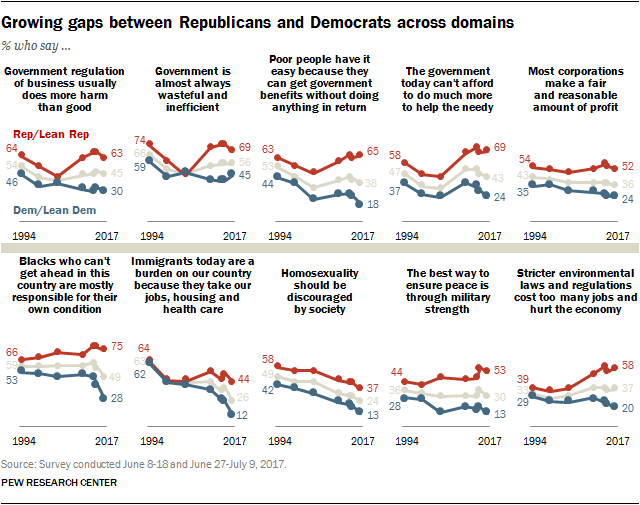
Pew has been polling using the same or similar questions for about 2 decades. There were roughly 20 questions polled, with the results shown, in their 2018 report. About half dealt with economic issues, a little less with social issues, and a few with international issues like diplomacy and the military.

While I won’t show all of the results, Pew itself put together the below set of responses to 10 of the questions, which are pretty representative of the overall sample:


I created a spreadsheet of the differences in responses between Democrats and Republicans since the inception of all 20+ questions, and also from 2014 (or sometimes from 2012 or 2010 if that result was called out numerically by Pew). While I won’t post the entire chart, suffice it to say that with the exception of government help for the needy, and whether environmental regulation hurts the economy, in which the GOP moved further off center since 2000, as to virtually all other issues Democrats did move further from center during the 2 decades, and in about half of the issues, moved considerably further from “median” positions since 2012 or 2014 than the GOP.

But the three most important issues by far, all of which are shown in the Pew graphs above, were racial discrimination (as to which Democrats shifted 13% further than GOPers since 2000, and 36% since 2010), government help for the needy (17%) - which many respondents undoubtedly viewed as a proxy for aid to racial minorities, and most of all immigration (23% and 29% in two variations of the issue).

Drum also cites several polls on whether respondents are “satisfied with” laws on guns and taxes, as to which, unsurprisingly, in 2017 GOPers were much more satisfied than Democrats compared with a decade or more earlier. 

Why? A bunch of state laws were passed easing gun restrictions, and the GOP Congress and Trump passed the “Tax Cuts and Jobs Act of 2017.” Since Democrats were very *dissatisfied* with those same new laws, the polls artificially make the Democrats’ response appear more extreme, because the responses are calibrated against a moving target.

There is pervasive evidence that while the US population skews heavily towards economic populism, on social issues there is virtually a 50/50 split. The main drivers of Democrats’ move to the left since 2014 have been on perceptions of racial discrimination and on the issue of immigration. The former is likely largely due to the whole “black lives matter” movement that stated out with the killing of Trayvon Martin in 2012, and picked up steam after shootings like those of Tamir Rice near Cleveland and Michael Brown in Ferguson, MO, in 2014. The latter has been heavily impacted by the plight of “Dreamers” who the GOP in Congress, and President Trump, consistently refused to protect.

On the broader issue of immigration, it is clear that it has been a problem for liberals not just in the US, but throughout Europe as well, and is in great degree responsible for driving the right wing authoritarian response in both places. In the past I have supported the idea of Democrats’ moderating their stance on that broad issue, employing a dual strategy of “the rule of law” as well as “the rule of equity” to minimize illegal immigration while granting full rights to Dreamers.  

I’ve also written in favor of making use of  a“K.I.S.S.” approach to new government programs, arguing that methods like Social Security and Medicare, which use FICA taxes in which everyone pays in, and everyone can take out, enjoy much broader support than programs that specifically pay out to the needy and phase out at working class incomes.

But to the extent that Drum is saying it is Democrats’ fault that they support Dreamers and Black Lives Matter - partly *in reaction to* more extreme actions by right wingers - I  strongly disagree. 

Sunday, July 4, 2021

For Independence Day 2021

 - by New Deal democrat

The Declaration of Independence, 1776:

We hold these truths to be self-evident, that all men are created equal, that they are endowed by their Creator with certain unalienable Rights, that among these are Life, Liberty and the pursuit of Happiness.--That to secure these rights, Governments are instituted among Men, deriving their just powers from the consent of the governed, --That whenever any Form of Government becomes destructive of these ends, it is the Right of the People to alter or to abolish it, and to institute new Government, laying its foundation on such principles and organizing its powers in such form, as to them shall seem most likely to effect their Safety and Happiness. 

Frederick Douglass, July 4, 1852:  

Pride and patriotism, not less than gratitude, prompt you to celebrate and to hold [July 4] in perpetual remembrance. I have said that the Declaration of Independence is the ring-bolt to the chain of your nation’s destiny; so, indeed, I regard it. The principles contained in that instrument are saving principles. Stand by those principles, be true to them on all occasions, in all places, against all foes, and at whatever cost. 
From the round top of your ship of state, dark and threatening clouds may be seen. Heavy billows, like mountains in the distance, disclose to the leeward huge forms of flinty rocks! That bolt drawn, that chain broken, and all is lost. Cling to this day — cling to it, and to its principles, with the grasp of a storm-tossed mariner to a spar at midnight.....
Fully appreciating the hardship to be encountered, firmly believing in the right of their cause, honorably inviting the scrutiny of an on-looking world, reverently appealing to heaven to attest their sincerity, soundly comprehending the solemn responsibility they were about to assume, wisely measuring the terrible odds against them, your fathers, the fathers of this republic, did, most deliberately, under the inspiration of a glorious patriotism, and with a sublime faith in the great principles of justice and freedom, lay deep the corner-stone of the national superstructure, which has risen and still rises in grandeur around you.Of this fundamental work, this day is the anniversary....  
Allow me to say, [ ] notwithstanding the dark picture I have this day presented of the state of the nation, I do not despair of this country. [  ] “The arm of the Lord is not shortened,” and the doom of slavery is certain. I, therefore, leave off where I began, with hope. While drawing encouragement from the Declaration of Independence, the great principles it contains, and the genius of American Institutions, my spirit is also cheered by the obvious tendencies of the age.

Abraham Lincoln, 1863: 

Four score and seven years ago our fathers brought forth on this continent, a new nation, conceived in Liberty, and dedicated to the proposition that all men are created equal. 
Now we are engaged in a great civil war, testing whether that nation, or any nation so conceived and so dedicated, can long endure.... 
.... It is for us the living, rather, to be dedicated here to the unfinished work which they who fought here have thus far so nobly advanced. It is rather for us to be here dedicated to the great task remaining before us -- that from these honored dead we take increased devotion to that cause for which they gave the last full measure of devotion -- that we here highly resolve that these dead shall not have died in vain -- that this nation, under God, shall have a new birth of freedom -- and that government of the people, by the people, for the people, shall not perish from the earth.

The struggle to make the aspirational words of Thomas Jefferson contained in the Declaration of Independence nearly 250 years ago a reality applicable to all, and not just the privilege of a select herrenvolk, continues.

Saturday, July 3, 2021

Weekly Indicators for June 28 - July 2 at Seeking Alpha


- by New Deal democrat

My Weekly Indicators post is up at Seeking Alpha.

The indicators in all time frames continue to be very positive, with mortgage rates continuing to tick down. We continue to have supply bottlenecks in “used” housing, cars, and a continued increase in gas prices - but so far no sign of any slowdown. The biggest immediate threat is the impact of the “delta variant” of COVID on the unvaccinated portions of the country.

As usual, clicking over and reading will bring you thoroughly up to date, and bring me a few pennies in my pocket.

Friday, July 2, 2021

June jobs report: a tale of two very different surveys - but both far from full recovery


 - by New Deal democrat

HEADLINES:
  • 850,000 jobs added. Of these, 662,000 were private sector jobs, and 188,000 were government jobs, chiefly in education. The alternate, and more volatile measure in the household report indicated a gain of only 128,000 jobs, which factors into the unemployment and underemployment rates below.
  • The total number of employed is still 6,764,000, or -4.4% below its pre-pandemic peak.  At this rate jobs have grown this year, it will take another full year for employment to completely recover.
  • U3 unemployment rate *rose* 0.1% to 5.9%, compared with the January 2020 low of 3.5%.
  • U6 underemployment rate declined -0.4% to 9.8%, compared with the January 2020 low of 6.9%.
  • Those on temporary layoff declined -12,000 to 1,811,000.
  • Permanent job losers declined -47,000 to 3,187,000.
  • April was revised downward by -9,000, while May was revised upward by 24,000, for a net gain of 15,000 jobs compared with previous reports.
Leading employment indicators of a slowdown or recession

These are leading sectors for the economy overall, and will help us gauge how strong the rebound from the pandemic will be.  These were mixed: 
  • the average manufacturing workweek decreased -0.2 hours to 40.2 hours. This is one of the 10 components of the LEI.
  • Manufacturing jobs rose 15,000. Since the beginning of the pandemic, manufacturing has still lost -481,000 jobs, or -3.8% of the total.
  • Construction jobs fell -7,000. Since the beginning of the pandemic, -238,000 construction jobs have been lost, or -3.1% of the total.
  • Residential construction jobs, which are even more leading, rose by 2,500. Since the beginning of the pandemic, 33,100 jobs have been gained in this sector, or 3.4%.
  • temporary jobs rose by 3,300. Since the beginning of the pandemic, there have still been -278,500 jobs lost, or -9.5% of all temporary jobs.
  • the number of people unemployed for 5 weeks or less declined by -42,000 to 1,981,000, which is  -101,000 *lower* than just before the pandemic hit.
  • Professional and business employment rose by 72,000, which is still 633,000, or about -2.9%, below its pre-pandemic peak.

Wages of non-managerial workers
  • Average Hourly Earnings for Production and Nonsupervisory Personnel: rose $0.10 to $25.68, which is a 3.7% YoY gain. This is excellent news, considering that many low-wage workers have finally been recalled to work. 

Aggregate hours and wages:
  • the index of aggregate hours worked for non-managerial workers declined by -0.1%, which is a  loss of -4.4% since just before the pandemic.
  •  the index of aggregate payrolls for non-managerial workers rose by 0.3%, which is a gain of 2.5% since just before the pandemic.

Other significant data:
  • Leisure and hospitality jobs, which were the most hard-hit during the pandemic, increased 343,000, but is still 2.2 million, or 12.9% below their pre-pandemic peak.
  • Within the leisure and hospitality sector, food and drink establishments gained 194,000, but is still -1,270,200, or -10.3% below their pre-pandemic peak.
  • Full time jobs decreased -183,000 in the household report.
  • Part time jobs increased 408,000 in the household report.
  • The number of job holders who were part time for economic reasons declined by 644,000 to 4,627,000, which is an increase of 229,000 since before the pandemic began.

SUMMARY

This month saw two very different components of the overall jobs report. The establishment survey, which tells us how many jobs were added or lost in various sectors, was very strong, while the household report, which tells us things about unemployment and underemployment, was very weak although still positive.

There was lots of good news in the hardest hit sectors of leisure and hospitality and eduction, which were responsible for over half of all the job gains; while manufacturing, construction, and professional and business services were either weakly positive or even slightly negative. Wage growth also continued strongly, which is certainly good news.

On the other hand, full time jobs as measured in the household report actually declined. But both permanent and temporary layoffs decreased, as did the newly unemployed, as did involuntary part time employment - all of which are very good.

Putting everything together, this month’s report showed substantial and steady progress, but nowhere near enough to fully recover from the pandemic for many months to come (and that’s not taking into account what may await as a result of increasing COVID cases due to the “delta” variant).

Thursday, July 1, 2021

June data starts out mixed: manufacturing strong, housing stalls


 - by New Deal democrat

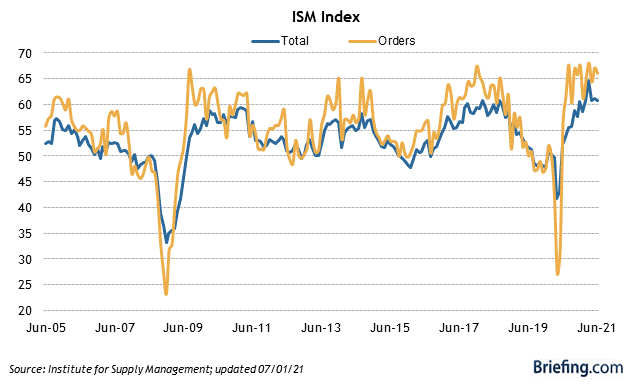
June data started out this morning with the ISM manufacturing report. There was no big change from last month’s torrid pace. The overall index declined a very slight -0.6% to 60.6, while the leading new orders component declined by 1 to 66:


Any number over 60 implies a very strong economy, so this report indicates that the manufacturing sector is still red hot.

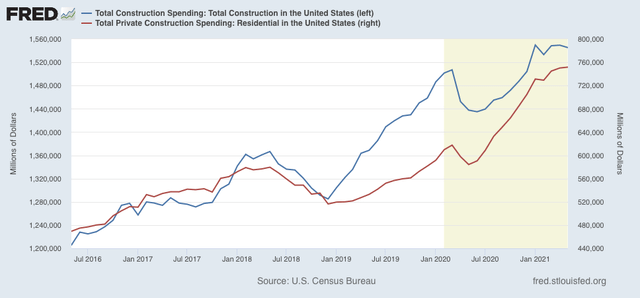
The last big May number, construction spending, was also reported, showing a definite cooling in the housing sector. Total spending actually declined a slight -0.3% from April, while the leading residential sector increased a slight 0.2%, even before taking into account inflation in housing materials:


In short, we start out the month with one leading sector, manufacturing, continuing to be very positive, while one long leading sector, housing, shows evidence of stalling if not a peak.

New jobless claims: a surprise to the positive side


 - by New Deal democrat

I have been paying particular attention to new jobless claims this year, as being the most important weekly economic datapoint to correlate with vaccination progress. My ultimate target for claims is an average of 325,000 or below, which would signify a return to normal expansion levels in the past 30 years.

Lasts week I wrote that “Unfortunately, that progress [in vaccinations] has largely stalled in the past month, and now new jobless claims appear to have stalled as well.”

For this week, at least, I was wrong - and am glad to be so if the positive trend lasts.

This week new jobless claims declined 51,000 to 364,000, a new pandemic low 10,000 below the previous low of 374,000 set three weeks ago. The 4 week average of claims also declined by 6,000 to a new pandemic low of 392,750. Here is the trend since last August:


By way of contrast, at the peak of the pandemic lockdowns in spring 2020, new claims were running 6 million to 7 million per week.

From late February into May, claims had trended down an average of roughly 100,000 per month. This had slowed to roughly 50,000 per month, and over the last 4 weeks, is only down about 35,000. This implies a much weaker employment report tomorrow for June than we saw in the March - May months.

Continuing claims, which are reported with a one week lag, and lag the trend of initial claims typically by a few weeks to several months, have only declined about 10% from roughly 3,750,000 over the past 3 1/2 months:


At least some of this decline *may* be due to many States’ termination of all extended jobless benefits due to the pandemic.

A long term perspective shows that these are equivalent to the worst levels of most previous recessions, or early in the expansions, versus at 2,000,000 or below later in strong expansions:


While I would like to believe that the good news is going to continue, there is no getting around that the “delta outbreak” has begun in the least vaccinated States of the Deep South and interior West, and is likely to follow an exponential scale over the next weeks and possibly months. 

So I continue to believe, as I first wrote three weeks ago, “I think we are going to see two tracks going forward from here, as near-normalcy does return to the more vaccinated parts of the country, while attempts to return to normalcy fail in the laggard regions.” And that implies at least a stall in the decline in new claims, and - I actually suspect - an increase, perhaps to about 450,000 per week or so.