Thursday, October 8, 2020

Jobless claims: yet another week of glacial progress


 - by New Deal democrat

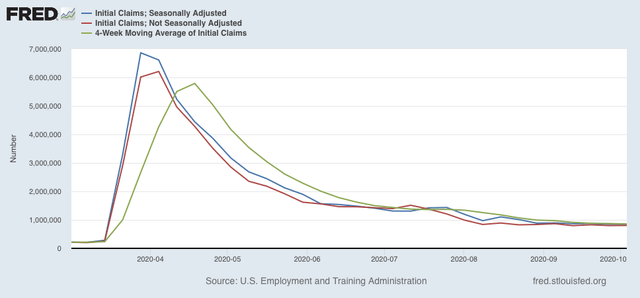
Today marked yet another week of glacial progress in initial jobless claims, at levels worse than the worst weekly levels of the Great Recession.

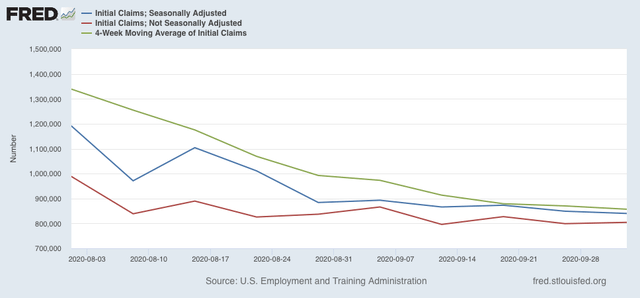
On a non-seasonally adjusted basis, new jobless claims rose by 5,312 to 804,307. After seasonal adjustment (which is far less important than usual at this time), claims fell by 9,000 to 840,000, another new pandemic low. The 4 week moving average also  declined by 13,250 to a new pandemic low of 857,000: 


Here is a close-up of the last two months highlighting the glacial progress in initial claims during the past 7 weeks:


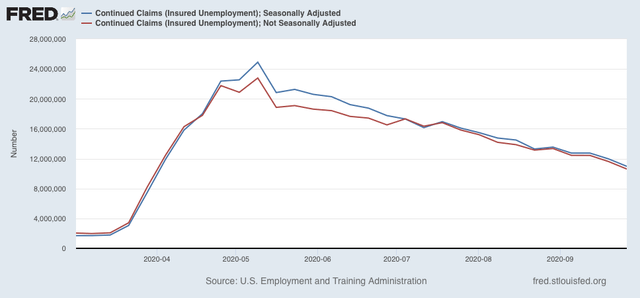
Continuing claims declined on a non-adjusted basis declined by -1,010,280 to 10,612,021. With seasonal adjustment they declined by 1,003,000 to 10,976,000. Both of these numbers are also new pandemic lows:


 Continuing claims are now about 60% below their worst level from the beginning of May, but remain about 4 million higher than their worst levels during the Great Recession.

There has been only very slow downward movement in new jobless claims over the past nine weeks. The pandemic shock recession is gradually turning into something much more chronic, with more long-term damage that will be more difficult to remedy.  

Wednesday, October 7, 2020

August JOLTS report conforms to prior early recession recovery pattern


 - by New Deal democrat

Yesterday’s JOLTS report for August showed a jobs market that is still just beginning to mend. Hires were up, and layoffs and discharges were down, which is good, but job openings and voluntary quits both declined.

We are far enough along past the worst of the pandemic jobs losses that it is worthwhile to compare the state of the various JOLTS components with the 2 previous recoveries from recession bottoms in the series’ histories (this because the JOLTS data only dates from 2001. 

In the two past recoveries:
  • first, layoffs declined
  • second, hiring rose
  • third, job openings rose and voluntary quits increased, close to simultaneously

Let’s examine each of those in turn. In each case, I break out 2001-19 in a first graph and then this year in a second.

This first graph compares layoffs and discharges (blue) with the 4 week average of initial jobless claims (red):
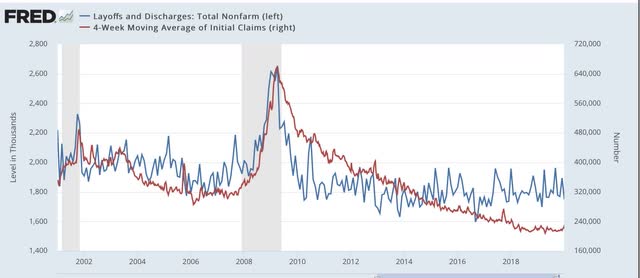
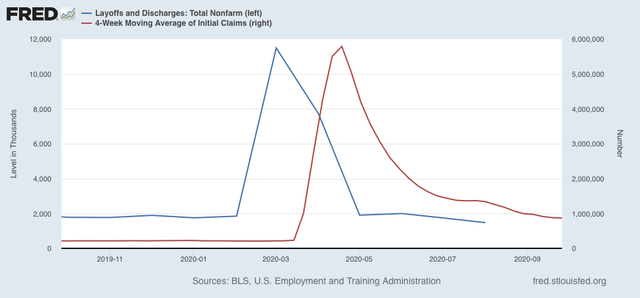

You can see that, by the end of the recessions, layoffs were already declining, and continued to decline steeply over the next 3-8 months before reaching a “normal” expansion level. The turning point coincides exactly with the much less volatile, but more slowly declining, level of initial jobless claims.

The same has been the case this year, as layoffs and discharges already declined to their “normal” level in May, while initial jobless claims peaked one to two months later, and have been declining (slowly) ever since.

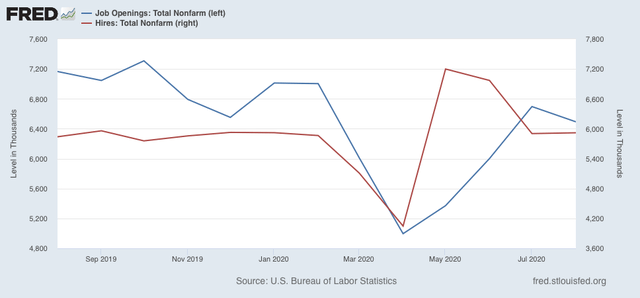
Next, here are hires (red) and job openings (blue):
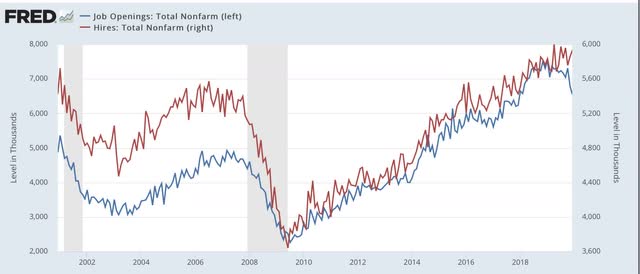


You can see that actual hires started to increase one to two months before job openings.

This year, both made troughs in April, but hires rebounded sharply in May and June compared with job openings.


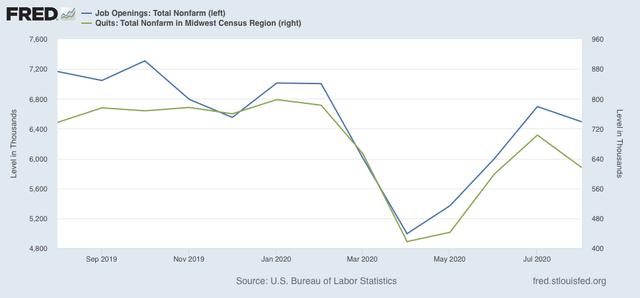
Finally, here are quits (green) vs. job openings (blue): 
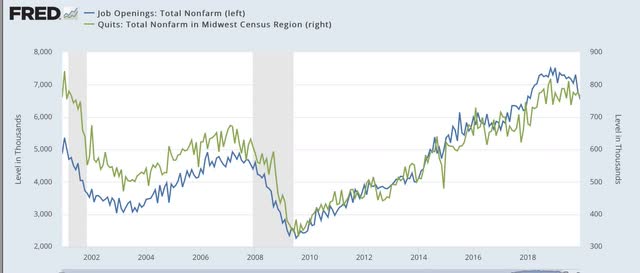


Actual hiring started to rise slightly before quits made a bottom. After that, both rose more or less together (suggesting it is openings that leads to the increase in voluntary quits)

Focusing on the past year, we see that both made a trough in April, and have risen equivalently since.

Although there has been some variation, the past several months have recapitulated the pattern from the last two early recoveries: the first two data series to turn - layoffs and hires - have indeed turned, while the last two - job openings and voluntary quits - have appeared to bottom but have had a much less dramatic rise.

Because seasonal adjustments might not be giving us a true picture during this pandemic year, here are job openings (blue), hires (red), and voluntary quits (green), measured YoY without seasonal adjustments for the recoveries after the 2001 and 2007-09 recessions:
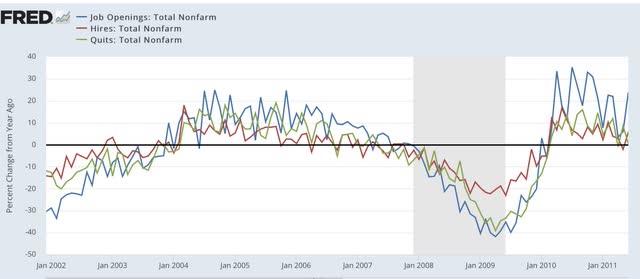
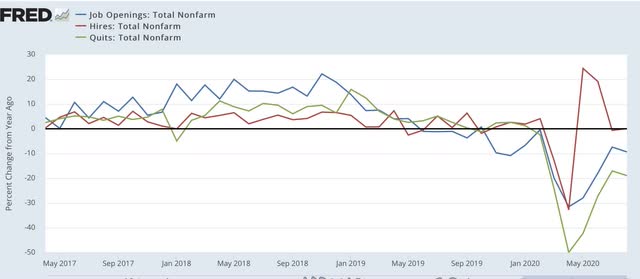
 
Note that, even taking out the seasonal adjustments, hires rebounded first, as they did after the 2001 recession. Quits and openings have moved generally in tandem.

I have broken out layoffs and discharges separately below, because the their level in April and May of this year would obliterate all other variations (note: inverted so that fewer layoffs shows as positive):
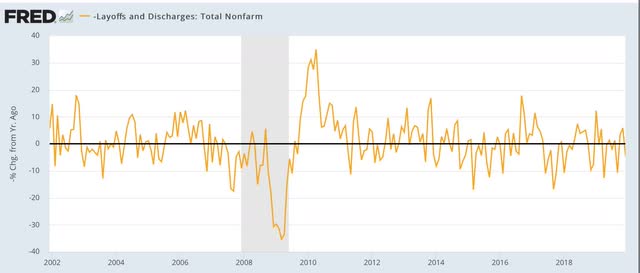
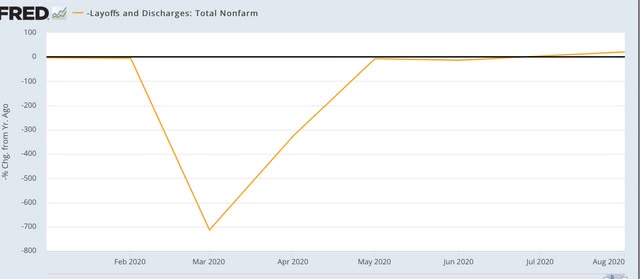


This metric returned to normal almost immediately after both of the past two recessions, and did so again by July of this year.

In short, the pandemic recovery in summer was real in the jobs market, but remained in its early stages. I emphasize that the virus remains in control, and should there be a renewed out of control surge this winter, the jobs market will react equivalently.
Tuesday, October 6, 2020

In 2020, the “Blue Wall” is holding


 - by New Deal democrat

At 10 a.m. Eastern time we’ll get the JOLTS report for August. I plan on posting on that later today, but in the meantime here’s an update on the Midwest “Blue Wall” that failed in the 2016 election.


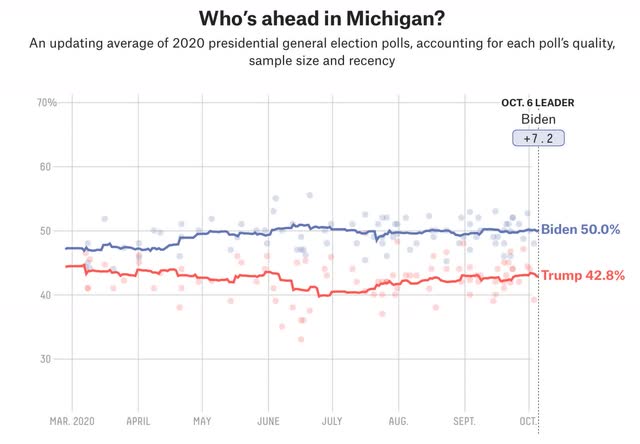
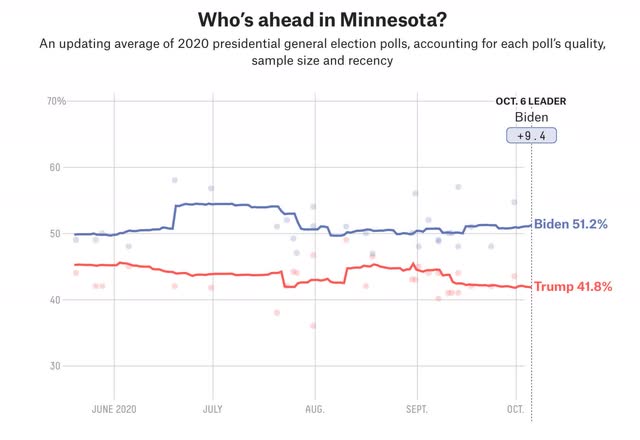
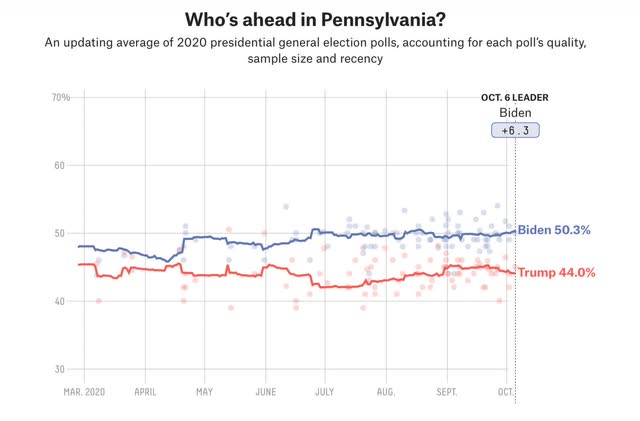
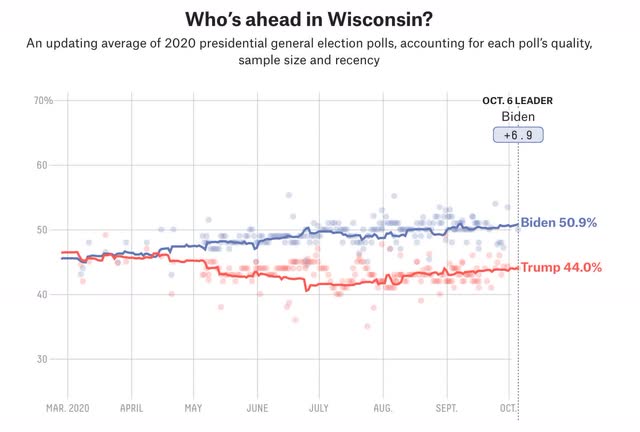
Below are the smoothed poll results for Michigan, Minnesota, Pennsylvania, and Wisconsin through yesterday: 


Despite the wide margins in all 4 States, Nate Silver gives Trump an 11% chance of winning Michigan, plus 10% in Minnesota, and 17% in both Pennsylvania and Wisconsin.

What is remarkable about all 4 graphs is how *stable* the results have been for the past 4 months, particularly in Michigan and Wisconsin. Minnesota’s variability during the summer appears to be an artifact of very light state polling. Pennsylvania did tighten somewhat in September, but has since reverted to baseline. Also note that Biden has 50% or higher support in all 4 States.

I don’t think Nate’s model takes into account this stability. If I run 50 polls over 3 months, and all 50 give an edge to one candidate, vs. a volatile trend where the lead changes, or vs. a situation with light polling, I have to think the first scenario is much more reliable than the 2nd or 3rd. In 2016, by contrast, there was much less state-level polling, and Hillary Clinton’s lead was considerably more variable.

With only 4 weeks to go until Election Day (and with a significant percentage of people already having cast their ballots), I am increasingly encouraged that Biden’s lead is not going to be meaningfully impacted by news events between now and then

Monday, October 5, 2020

2020 Presidential and Senate polling nowcast through October 3: a partial rebound for Biden


 - by New Deal democrat

Here is my weekly update on the 2020 elections, based on State rather than national polling in the past 30 days, since that directly reflects what is likely to happen in the Electoral College. Remember that polls are really only nowcasts, not forecasts. They are snapshots of the present; there is no guarantee they will be identical or nearly identical in early November.

A special reminder: these polls were all taken before Trump’s COVID-19 diagnosis, and only a few were entirely after the debate. 

The best news for Trump, and the worst news for Biden, is that despite an awful debate performance, Trump’s approval *rose* 0.7% over the past week, while his disapproval dropped 0.4%. He is now near the upper end of his normal range of approval going back 3.5 years: 


This may be a reaction to his nomination of a Judge for the Supreme Court who is on record saying that both Roe v. Wade and the ACA should be overturned. It is way too soon for Trump’s COVID-19 diagnosis to be showing up in these polls.

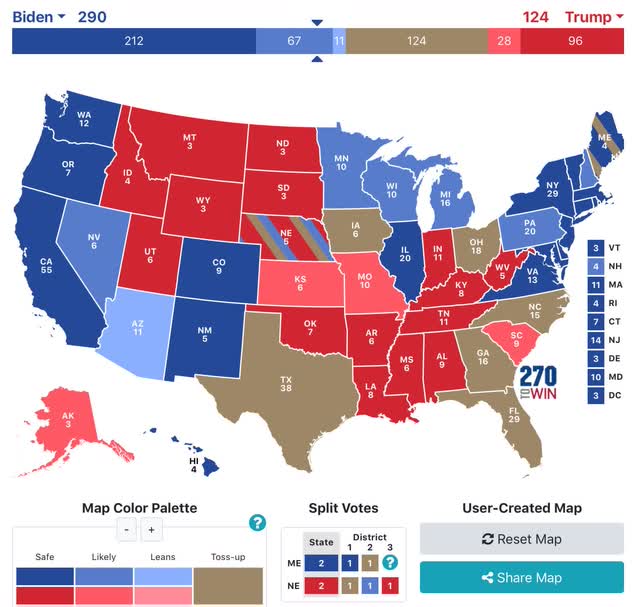
Turning to the Presidential elections, here is this week’s updated map through September 26. To refresh, here is how  it works:

- States where the race is closer than 3% are shown as toss-ups.
- States where the range is between 3% to 5% are light colors.
- States where the range is between 5% and 10% are medium colors.
- States where the candidate is leading by 10% plus are dark colors.


One week ago there were a number of changes adverse to Biden. The good news for him is that this week most reversed. Pennsylvania and New Hampshire both improved back to “likely Biden,” and Virginia improved from “likely” to “solid Biden.” Arizona remains “lean Biden,” however, and Florida remains a toss-up. Also, several States in the Deep South and Appalachia, which had only been lightly polled, were polled again this week and moved to “solid GOP,” but this was expected and does not change any significant calculations.
 
As a result Biden’s “solid” plus “likely” Electoral College votes improved from 255 last week to 279 this week, although they remain below their peak of 302 two months ago.

Biden’s support also improved to 50% or more in Michigan New Hampshire, and Pennsylvania, in addition to Wisconsin and Minnesota. This makes it much harder for Trump to mount a successful comeback in those States.
  
With the September jobs report in the books, all of the important pre-election economic reports are done. The economic recovery from the depths of the coronavirus has decelerated sharply. I have been expecting some incremental improvement in Trump’s position as voters who were leaning GOP “come home,” and this probably is happening among some alleged swing voters. Last week I said that the final right-wing takeover of the Supreme Court would probably be front and center for October, along with Trump’s refusal to commit to an orderly transition if he loses. Trump’s COVID-19 diagnosis and hospitalization at least temporarily puts an end to the latter, but its ultimate effect on voting is, to say, the least, unclear.
  
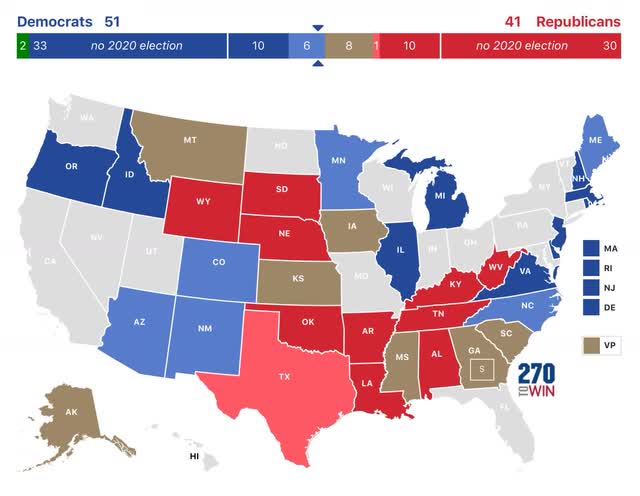
Turing to the Senate, the only change this week was important, as the second Georgia Senate race also turned from “lean GOP” to “toss-up”:


At current polling, if Democrats win all those seats rated “solid” and “likely,” they will have 51 Senate seats. With 8 races now rated “toss-ups,” if they were to take them all they would have 59 seats. and have improved from 55 to 59 in the past two weeks if they were to win all of the “toss-ups.”

In short, Democrats look in better and better shape to obtain a majority in the Senate.