Saturday, May 16, 2015
Weekly Indicators for May 11 - 15 at XE.com
- by New Deal democrat
My Weekly Indicator post is up at XE.com. The overly strong US dollar has put the industrial sector of the US economy into a shallow recession, and brought the wider economy to a complete standstill.


Friday, May 15, 2015
What's killing steel is the same thing that's ailing rail
- by New Deal democrat
I have a new post up at XE.com.
The main culprit behind recent poor US economic performance is now pretty clear.
I Finally Have An Explanation For John Hinderaker
How can a person who is literally 100% wrong on economic analysis continue to think they have something to say? Now I know.
The Dunning–Kruger effect is a cognitive bias wherein unskilled individuals suffer from illusory superiority, mistakenly assessing their ability to be much higher than is accurate. This bias is attributed to a metacognitive inability of the unskilled to recognize their ineptitude.
Hinderaker just doesn't recognize his stupidity because he's that stupid.
Tuesday, May 12, 2015
Monday, May 11, 2015
Sunday, May 10, 2015
Saturday, May 9, 2015
Weekly Indicators for May 4 - 8 at XE.com
- by New Deal democrat
My Weekly Indicator post is up at XE.com. This week's big move in interest rates is front and center.
Friday, May 8, 2015
April jobs report: much better, but an alarm on leading indicators
- by New Deal democrat
HEADLINES:
- 223,000 jobs added to the economy
- U3 unemployment rate down -0.1% to 5.4%
With the expansion firmly established, the focus has shifted to wages and the chronic heightened unemployment. Here's the headlines on those:
Wages and participation rates
- Not in Labor Force, but Want a Job Now: down -111,000 from 6.369 million to 6.258 million
- Part time for economic reasons: down -125,000 from an upwardly revised 6.705 million to 6.580 million
- Employment/population ratio ages 25-54: unchanged at 77.2%
- Average Weekly Earnings for Production and Nonsupervisory Personnel: up +0.1% from an upwardly revised $20.88 to $20.90, up +1.9%YoY, a slight increase. (Note: you may be reading different information about wages elsewhere. They are citing average wages for all private workers. I use wages for nonsupervisory personnel, to come closer to the situation for ordinary workers.)
The more leading numbers in the report tell us about where the economy is likely to be a few months from now. These were mixed but with a negative bias for the third month in a row.
- the average manufacturing workweek fell -0.1 hours from 40.9 hours to 40.8 hours. This is one of the 10 components of the LEI and so will affect it negatively.
- construction jobs rose by 45,000. YoY construction jobs are up 280,000.
- manufacturing jobs rose 1,000, and are up 178,000 YoY.
- Professional and business employment (generally higher-paying jobs) rose 62,000 and are up 654,000 YoY.
- temporary jobs - a leading indicator for jobs overall - rose by 14,100.
- the number of people unemployed for 5 weeks or less - a better leading indicator than initial jobless claims - increased by 241,000 to 2,729,000, compared with December 2013's low of 2,255,000.
Other important coincident indicators help us paint a more complete picture of the present:
- Overtime decreased by 0.1 hour from 3.3 hours to 3.2 hours
- the index of aggregate hours worked in the economy rose 0.2 from a downwardly revised 102.8 to 103.0.
- The broad U-6 unemployment rate, that includes discouraged workers decreased from 10.9% to 10.8%
- the index of aggregate payrolls rose by 0.4% from a downwardly revised 121.9 to 122.3.
- the alternate jobs number contained in the more volatile household survey increased by 192,000 jobs. This represents a 2,799,000 million increase in jobs YoY vs. 2,982,000 in the establishment survey.
- Government jobs increased by 10,000.
- the overall employment to population ratio for all ages 16 and above was unchanged at 59.3%, and has risen by +0.4% YoY. The labor force participation rate also rose 0.1% from 62.7% to 62.8% and is unchanged YoY (remember, this includes droves of retiring Boomers).
SUMMARY:
Of course this was welcome news after a bad March report, which got even worse with downward revisions. Still, the positive news in this report overcame even those revisions.
The best news in the report, beyond the headline numbers, was the positive movement in the underemployment statistics: both those not in the labor force but who want a job now, and those part time for economic reasons, declined. YoY wage growth increased, as did aggregate hours and payrolls. The big increase in construction jobs shows how the particularly nasty winter did affect employment.
But the leading portions of the employment report are sounding an alarm. The manufacturing workweek was down. Overtime was down. Unemployment from zero to 5 weeks increased significantly. Revisions to prior months were negative. This is the third month of this negative trend in the leading indicators in the employment report. In my "Weekly Indicators" column, for the last month I have said that the US is in a shallow manufacturing recession. Today's report confirms that.
While the Oil patch weakness behind some of that may continue, the big unknown is whether the overly strong dollar continues to kill exports and the manufacturing behind those exports. My best guess (or hope?) is that the dollar will weaken and the situation will stabilize or abate somewhat.
Thursday, May 7, 2015
Has a strong US dollar precipitated prior US recessions?
- by New Deal democrat
Yesterday I explained that the reason for the continued YoY weakness in rail transport was primarily coal, and that in turn was caused by the strong US dollar killing exports compared with now-cheaper producers.
Particularly in light of the poor, perhaps negative, first quarter GDP, that raises the question: In the past, has the strong dollar been associated with US recessions? I discuss this in a new post up at XE.com.
BTW, according to Recession ALERT, the globe entered recession in February.
Wednesday, May 6, 2015
Unit labor costs increase by 1%+ in Q1
- by New Deal democrat
The price commanded by labor for a unit of output increased in the first quarter, making a new post-recession high:

This is another sign that wages are finally participating in the expansion:
The only problem with labor costs is if they outstrip the ability of the employer to absorb them and maintain a given profit level. Since other commodity prices have plummeted (brown in the graph below), and producer prices for final goods have declined but not so much (red),

employers should be OK while employees/consumers benefit from increased wages and flat consumer prices.
What's ailing US rail transport?
- by New Deal democrat
I have a new post up at XE.com, explaining why US rail shipments fell off a cliff in mid-February and haven't recovered since.
Incentives and behavior: psychology vs. economics
- by New Deal democrat
This morning the NY Times reviews the book "Misbehaving" by Richard Thaler, the current President of the American Economic Association, in which he pillories the dominant Chicago school style of economics:
After so-called behavioral economics began to go mainstream, Professor Thaler turned his attention to helping solve a variety of business and, increasingly, public policy issues. As these tools have been applied to practical problems, Professor Thaler has noted that there has been “very little actual economics involved.” Instead, the resulting insights have “come primarily from psychology and the other social sciences.
To the extent that economists fought the integration of behavioral insights into economic analyses, it seems that their fears were founded. Rather than making the resulting work less rigorous, however, it simply made its economic underpinnings less relevant. Professor Thaler argues that it is actually “a slur on those other social sciences if people insist on calling any policy-related research some kind of economics.”
Professor Thaler's narrative ultimately demonstrates that by trying to set itself as somehow above other social sciences, the "rationalist" school of economics, actually ended up contributing far less than it could have.
Ouch! That's gotta sting.
Contrast this with a statement by Brad Delong just a few days ago:
Arthur Burns was right: you [economists] are better-positioned than any other group to help us make the right choices, at the level of the world and of the country as a whole, but also at the level of the state, the city, the business, the school district, the NGO seeking to figure out how to spend its limited resources–whatever.''''[Why?] I would say:....
- Economists know about systems, and how systems work:
- Supply and demand
- Opportunity cost
- General equilibrium
- Incentives and behavior
(my emphasis)
Excuse me??? Didn't Thaler just hand you your head on point number 4?
Here's a nice, simple question. How do you get more of a behavior?
- Economists say: increase the incentive
- Psychologists say: variable reinforcement
These are two apparently contradictory answers.
Now, I suspect that if a psychologist put a rat in a cage with two bars dispensing food pellets, and one dispensed a pellet on a variable schedule, and the other always dispensed two pellets, the rat is going to press the lever that gives him more food. Score one for Econ.
But suppose, after the rat learns to press that lever, I divide the cage in such a way that, once the rat chooses one bar, it is very difficult to get over to the unchosen bar. The rat makes its choice ("two pellets all the time, please"), and now I start cutting back on the pellets, and only periodically and variably dispensing a pellet. Now I am going to get a ton of bar-pressing for diminishing rewards. Score one for Psych.
Now, I suspect that if a psychologist put a rat in a cage with two bars dispensing food pellets, and one dispensed a pellet on a variable schedule, and the other always dispensed two pellets, the rat is going to press the lever that gives him more food. Score one for Econ.
But suppose, after the rat learns to press that lever, I divide the cage in such a way that, once the rat chooses one bar, it is very difficult to get over to the unchosen bar. The rat makes its choice ("two pellets all the time, please"), and now I start cutting back on the pellets, and only periodically and variably dispensing a pellet. Now I am going to get a ton of bar-pressing for diminishing rewards. Score one for Psych.
Now think about annual compensation schemes by large corporations. The metrics constantly vary, and the weighting of each metric varies. The employee-rat having made its choice (by accepting employment), the employer-experimenter tries to maximize the desired behaviors by the employees by variably dispensing ever-slightly-decreasing and sporadic rewards. Since the employee doesn't know which job aspect will be the most rewarded in the next year end compensation scheme, the employee tries to do the most of all of them. Variable reinforcement, thank you very much.
And to bring this back to the big economic issue, one thing we know about humans is that we try - asymmetrically - to avoid actually realizing losses. In 1929, in order to forestall repossession of goods bought on installment payment plans, consumers stopped spending money in far larger proportion to the initial downturn. Similarly, in September 2008, in order to prepare for the sudden emergency that Bush et al told them might only be days away, consumers en masse simply stopped spending.
To refresh your memory, on September 19, 2008, the NY Times reported that, "As the Fed chairman, Ben S. Bernanke, laid out the potentially devastating ramifications of the financial crisis before congressional leaders on Thursday night, there was a stunned silence at first. Senator Christopher J. Dodd [said] the congressional leaders were told “that we’re literally maybe days away from a complete meltdown of our financial system, with all the implications here at home and globally." And on September 24, it reported, "President George W. Bush on Wednesday warned Americans and legislators reluctant to pass a historic financial rescue plan that failing to act fast risks wiping out retirement savings, rising foreclosures, lost jobs, closed business and “a long and painful recession.”
To refresh your memory, on September 19, 2008, the NY Times reported that, "As the Fed chairman, Ben S. Bernanke, laid out the potentially devastating ramifications of the financial crisis before congressional leaders on Thursday night, there was a stunned silence at first. Senator Christopher J. Dodd [said] the congressional leaders were told “that we’re literally maybe days away from a complete meltdown of our financial system, with all the implications here at home and globally." And on September 24, it reported, "President George W. Bush on Wednesday warned Americans and legislators reluctant to pass a historic financial rescue plan that failing to act fast risks wiping out retirement savings, rising foreclosures, lost jobs, closed business and “a long and painful recession.”
Professor Delong's statement that economists best know about incentives and behavior stands in stark contrast with his concession a few days earlier that a new macroeconimc paradigm was needed, and he honestly didn't know what that should be:
This entire structure is now in ruins. Our social-democratic income distribution has been upending in an appalling manner by the Second Gilded Age. Our government, here in the U.S. at least, has been starved of proper funding for infrastructure of all kinds since the election of Ronald Reagan. Our confidence in our institutions' ability to manage aggregate demand properly is in shreds--and for the good reason of demonstrated incompetence and large-scale failure. Our political system now has a bias toward austerity and idle potential workers rather than toward expansion and inflation. Our political system now has a bias away from desirable borrow-and-invest. And the equity return premium is back to immediate post-Great Depression levels--and we also have an enormous and costly hypertrophy of the financial sector that is, as best as we can tell, delivering no social value in exchange for its extra size.
We badly need a new framework for thinking about policy-relevant macroeconomics given that our new normal is as different from the late-1970s as that era's normal was different from the 1920s, and as that era's normal was different from the 1870s.
So long as economists think that they are the ones who know the best about human incentives and behavior, they are going to continue to stumble along in the dark and their public policy prescriptions are likely to inflict much unnecessary harm on millions of people.
Tuesday, May 5, 2015
A rantette about China-related data
- by New Deal democrat
It's getting hard to find Doomer dataporn. Maybe that's a contrarian sign? Even the DK Doomers have moved on from the economy to other reasons by we are going to hell in a handbasket. There's ZH of course, but that is mainly C-level stuff. Mish is still capable of taking a deep dive into the numbers, and is worthwhile. Then there is Naked Capitalism, which twice a day posts thorough linkfests that usually have one or two items of good info.
This morning NC's linkfest led me to an article about how Chinese shipping data shows were all DOOOMED. That in turn led me to the HSBC Chinese factory PMI, which the latest clickbait at Business Insider telling me is in contraction, and at a one year low. OMG!!!
Except when I go find a longer term graph of the HCBC Chinese PMI, here's what it shows:
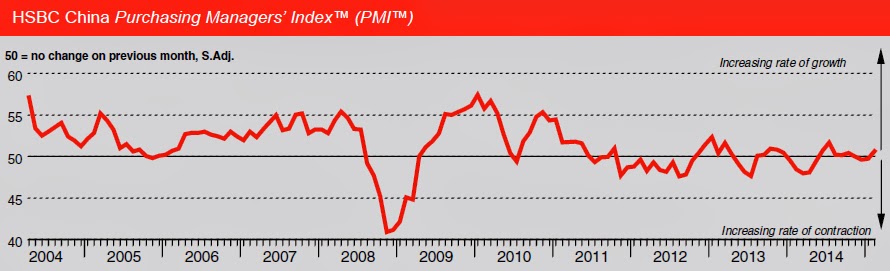
Apparently Chinese manufacturing has been in a state of contraction, with respites of mediocre expansion, ever since 2011! Pretty amazing for the secularly fastest-growing economy on the planet.
That doesn't mean the index is useless. Its upward and downward moves might well correlate with faster or slower rates of expansion. If we add, say, +5 to every reading, then we might actually start getting concerned if it drops below 45.
But this is why I put very little faith in any number attempting to describe China, especially if it has to rely on the accuracy of domestic Chinese data. Someday out there China is going to go into an actual recession, but the CCP has far too much at stake than to allow poor data to be accurately reported. Which is why I generally treat data about the Chinese economy as emanating from a block box. In a darkened room. In the dead of night. At the time of a new moon.
Sunday, May 3, 2015
Saturday, May 2, 2015
Weekly Indicators for April 27 - May 1 at XE.com
- by New Deal democrat
My Weekly Indicators post is up at XE.com.
I am in agreement with ECRI's Lakshman Achuthan (h/t Doug Short).
Friday, May 1, 2015
Four measures of real wage stagna-- ... er, slight improvement
- by New Deal democrat
In the last several years, I have written a number of posts documenting the stagnation in average and median wages, for example here and here. Courtesy of the crash in gas prices, there has been a bit of a change in the last 8 months.
We have a variety of economic data series to track both average and median wages:
- The most commonly known measure is that of average hourly pay for nonsupervisory workers, which is part of the monthly jobs report.
- The Bureau of Labor Statistics, which conducts the household employment survey, also reports "usual weekly earnings" for full time workers each quarter.
- The BLS also measures the Employment Cost Index quarterly.
- The BLS also measures "business sector real compensation per hour" quarterly.
The first graph tracks monthly average (mean, not median) hourly wages (blue), median wages from the employment cost index (red), real compensation per hour (brown), and median usual weekly earnings (green). All are adjusted for inflation. Since the quarterly index of median wages only started in Q1 2001, I have normed the indexes to 100 at that time:

The median measure of the Employment Cost Index made a new high. Real compensation per hour through the end of last year equalled its past highs. Average wages for nonsupervisory workers made a new 35 year high. Only the median measure of real weekly earnings is still languishing well off their 2010 high.
Here is the same data measured YoY:

While this is noisy, it shows the impact of the big decrease in gas prices late in the recession, their increase back to near $4 in 2011 and 2012, and the big decline in late 2014. Here's a close-up of the same YoY data since the beginning of 2014:

How this breakout is affected by the complete absence of inflation is shown when we look at the raw numbers nominally:

Median wages as measured by the Employment Cost Index did indeed show accelerated growth in Q1, while average wage growth actually decelerated, as did growth in real usual weekly earnings. So, there's some qualified good news here. Real wages have actually increased by nearly all measures. But by most measures it isn't due to workers suddenly getting better raises.
Thursday, April 30, 2015
Bernanke 1; WSJ Editorial Board 0
From Bernanke's Blog
It's generous of the WSJ writers to note, as they do, that "economic forecasting isn't easy." They should know, since the Journal has been forecasting a breakout in inflation and a collapse in the dollar at least since 2006, when the FOMC decided not to raise the federal funds rate above 5-1/4 percent.
and then there is this:
The WSJ also argues that, because monetary policy has not been a panacea for our economic troubles, we should stop using it. I agree that monetary policy is no panacea, and as Fed chairman I frequently said so. With short-term interest rates pinned near zero, monetary policy is not as powerful or as predictable as at other times. But the right inference is not that we should stop using monetary policy, but rather that we should bring to bear other policy tools as well. I am waiting for the WSJ to argue for a well-structured program of public infrastructure development, which would support growth in the near term by creating jobs and in the longer term by making our economy more productive. We shouldn't be giving up on monetary policy, which for the past few years has been pretty much the only game in town as far as economic policy goes. Instead, we should be looking for a better balance between monetary and other growth-promoting policies, including fiscal policy.
Just beautiful.
It's generous of the WSJ writers to note, as they do, that "economic forecasting isn't easy." They should know, since the Journal has been forecasting a breakout in inflation and a collapse in the dollar at least since 2006, when the FOMC decided not to raise the federal funds rate above 5-1/4 percent.
and then there is this:
The WSJ also argues that, because monetary policy has not been a panacea for our economic troubles, we should stop using it. I agree that monetary policy is no panacea, and as Fed chairman I frequently said so. With short-term interest rates pinned near zero, monetary policy is not as powerful or as predictable as at other times. But the right inference is not that we should stop using monetary policy, but rather that we should bring to bear other policy tools as well. I am waiting for the WSJ to argue for a well-structured program of public infrastructure development, which would support growth in the near term by creating jobs and in the longer term by making our economy more productive. We shouldn't be giving up on monetary policy, which for the past few years has been pretty much the only game in town as far as economic policy goes. Instead, we should be looking for a better balance between monetary and other growth-promoting policies, including fiscal policy.
Just beautiful.
Rents spike to new record in Q1
- by New Deal democrat
Tuesday the Census Bureau released its quarterly report on homeownership. While the bulk of the commentary focused on the homeownership rate, and price of housing, I would like to focus on apartment rentals. The share of apartment building compared to single family home construction has jumped since the last recession, partly due to the swelling demographic of Millennials entering the market, and partly due to stagnant wages.
Here is the rental vacancy rate compared with the homeowner vacancy rate:
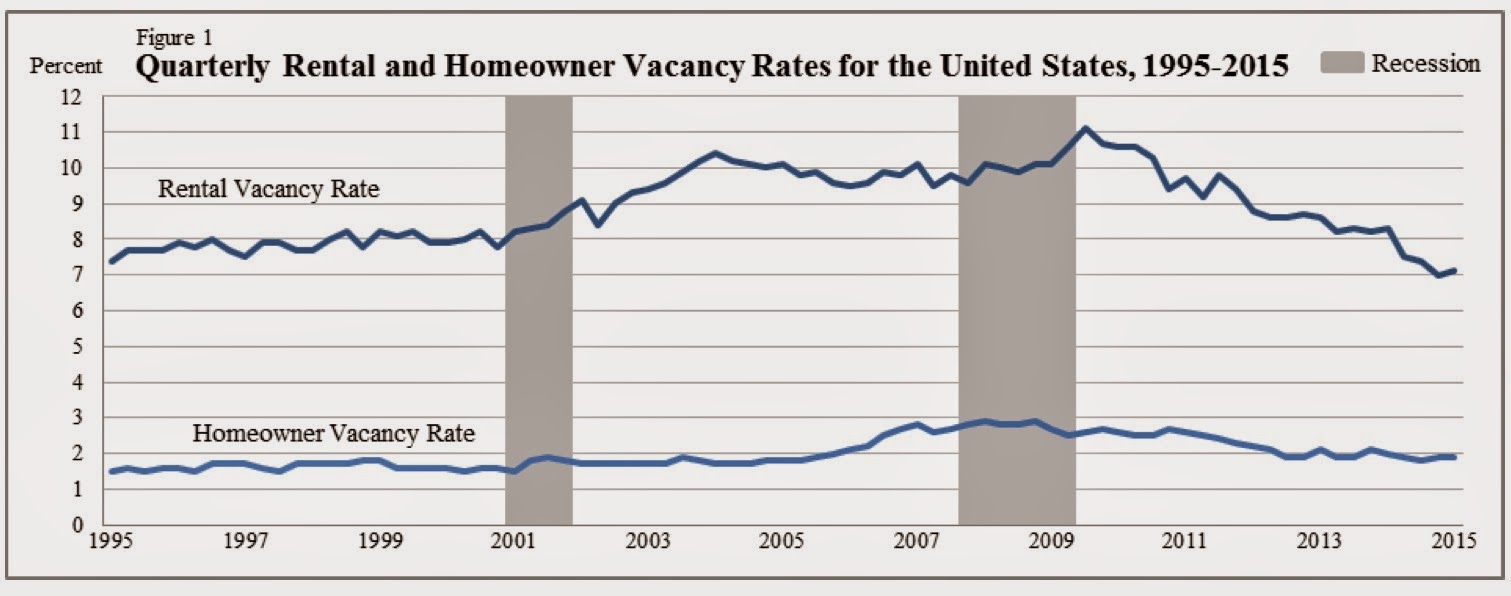
Rental vacancies made a record low in the 4th quarter of 2014, and bounced up just a little in the first quarter of 2015.
This is the flip side of the 20-year low in homeownership rates:

Unsurprisingly, in nominal terms, the median asking rent has been rising to new records in the last several years:

But that doesn't tell us what has been going on in real terms. To do that, we should adjust for inflation, or alternatively by wages. That is what I have done in the chart below. It shows nominal asking rents vs. median weekly wages as compiled by the BLS. It shows that real rents declined in the 1990s as wages increased, soared in the 2000 - 2009 period, and had remained below that peak ever since -- until this past quarter:
| Year | Median Asking Rent | Usual weekly earnings | Rent as % of earnings | Real median asking rent |
|---|---|---|---|---|
| 1988 | 330 | 382 | 86 | 657 |
| 1992 | 401 | 437 | 92 | 674 |
| 1993 | 422 | 450 | 88 | 688 |
| 2000 | 478 | 568 | 84 | 655 |
| 2002 | 545 | 607 | 90 | 714 |
| 2004 | 620 | 629 | 99 | 774 |
| 2009 | 723 | 739 | 99 | 795 |
| 2012 | 721 | 768 | 94 | 740 |
| 2013 | 734 | 776 | 95 | 743 |
| 2014 Q1 | 766 | 790 | 97 | 765 |
| 2014 Q2 | 756 | 782 | 97 | 751 |
| 2014 Q3 | 756 | 797 | 95 | 749 |
| 2014 Q4 | 766 | 796 | 96 | 760 |
| 2015 Q1 | 799 | 802 | 100 | 799 |
In the first quarter, for the first time in history, the median asking rent equaled the entire weekly earnings of the median worker.
Even worse, the median wage of all workers does not quite accurately capture the median wage of renters, since they tend to be from lower income groups. And as the graph below compiled by the Employment Law Project from last August shows, the median real wage of the 4th and 5th quintile as of then had declined more than the median real wage of workers overall compared with their 2009 peak:

Looking at multi-unit housing construction helps us distill some signal from the noise. First of all, after booming in earlier 2014, apartment construction has declined slightly:
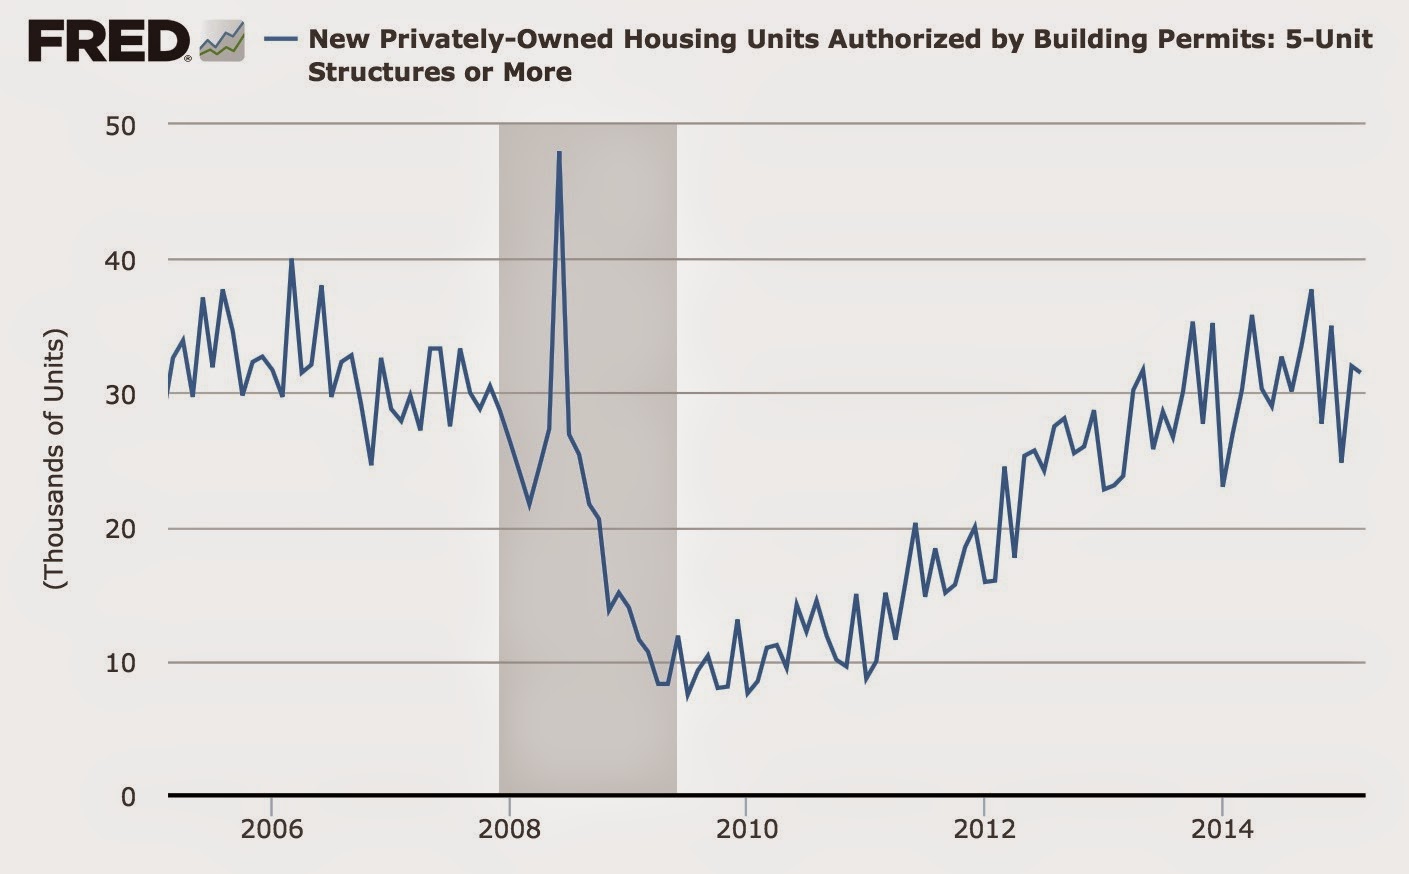
A second important point is the regional difference in the data. Below is a portion of the Census Bureau's table showing median asking rents nationwide (1st column), and broken down by regions: Northeast (2nd column), Midwest (3rd), South (4th), and West (5th):

As you can see, the lion's share of the increase in the 1st quarter was a nearly 10% increase in asking rents in the Western region. As the chart below shows, the West also has the lowest vacancy rate of any of the regions (although the Northeast is also very low):

It's certainly possible that the spike in rents in the Western region is noise due to small sample size, but a comparison of housing permits in the West vs. the Northeast, both of which regions have especially low vacancy rates, shows that from miid-2013 to mid-2014, in all but one quarter issuance of permits slowed more in the West than in the Northeast:

Given the lag in completions of apartment buildings after permits are issued, this is what I would expect given the jump in rental prices in the West.
I do expect that some of the spike in asking rents int he first quarter will prove to have been noise, but it is unwelcome nevertheless. But with low vacancy rates, the big increase in rents, and the continuing tailwind of Millennial household formation, I expect the slowdown in apartment construction to be transitory.
Even worse, the median wage of all workers does not quite accurately capture the median wage of renters, since they tend to be from lower income groups. And as the graph below compiled by the Employment Law Project from last August shows, the median real wage of the 4th and 5th quintile as of then had declined more than the median real wage of workers overall compared with their 2009 peak:
Looking at multi-unit housing construction helps us distill some signal from the noise. First of all, after booming in earlier 2014, apartment construction has declined slightly:
A second important point is the regional difference in the data. Below is a portion of the Census Bureau's table showing median asking rents nationwide (1st column), and broken down by regions: Northeast (2nd column), Midwest (3rd), South (4th), and West (5th):
As you can see, the lion's share of the increase in the 1st quarter was a nearly 10% increase in asking rents in the Western region. As the chart below shows, the West also has the lowest vacancy rate of any of the regions (although the Northeast is also very low):
It's certainly possible that the spike in rents in the Western region is noise due to small sample size, but a comparison of housing permits in the West vs. the Northeast, both of which regions have especially low vacancy rates, shows that from miid-2013 to mid-2014, in all but one quarter issuance of permits slowed more in the West than in the Northeast:
Given the lag in completions of apartment buildings after permits are issued, this is what I would expect given the jump in rental prices in the West.
I do expect that some of the spike in asking rents int he first quarter will prove to have been noise, but it is unwelcome nevertheless. But with low vacancy rates, the big increase in rents, and the continuing tailwind of Millennial household formation, I expect the slowdown in apartment construction to be transitory.
Subscribe to:
Posts (Atom)