- by New Deal democrat
Tuesday the Census Bureau released its quarterly report on homeownership. While the bulk of the commentary focused on the homeownership rate, and price of housing, I would like to focus on apartment rentals. The share of apartment building compared to single family home construction has jumped since the last recession, partly due to the swelling demographic of Millennials entering the market, and partly due to stagnant wages.
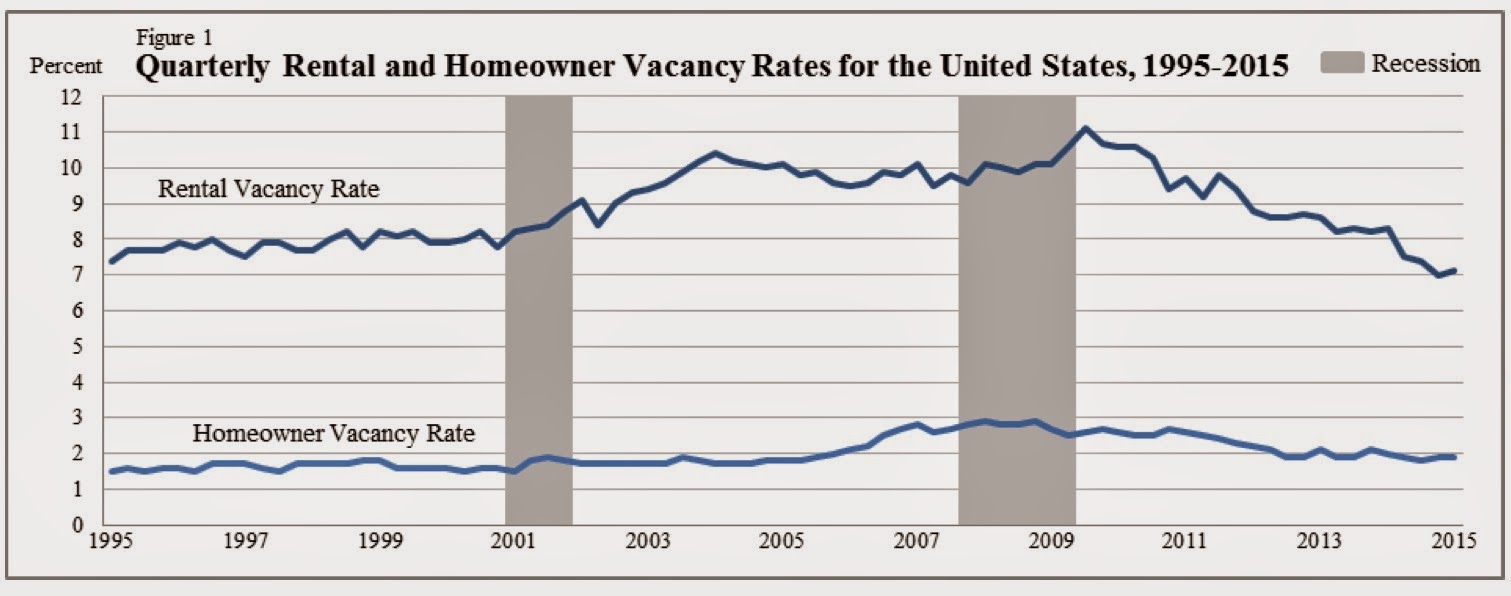
Here is the rental vacancy rate compared with the homeowner vacancy rate:
Rental vacancies made a record low in the 4th quarter of 2014, and bounced up just a little in the first quarter of 2015.
This is the flip side of the 20-year low in homeownership rates:
Unsurprisingly, in nominal terms, the median asking rent has been rising to new records in the last several years:
But that doesn't tell us what has been going on in real terms. To do that, we should adjust for inflation, or alternatively by wages. That is what I have done in the chart below. It shows nominal asking rents vs. median weekly wages as compiled by the BLS. It shows that real rents declined in the 1990s as wages increased, soared in the 2000 - 2009 period, and had remained below that peak ever since -- until this past quarter:
| Year | Median Asking Rent | Usual weekly earnings | Rent as % of earnings | Real median asking rent |
|---|---|---|---|---|
| 1988 | 330 | 382 | 86 | 657 |
| 1992 | 401 | 437 | 92 | 674 |
| 1993 | 422 | 450 | 88 | 688 |
| 2000 | 478 | 568 | 84 | 655 |
| 2002 | 545 | 607 | 90 | 714 |
| 2004 | 620 | 629 | 99 | 774 |
| 2009 | 723 | 739 | 99 | 795 |
| 2012 | 721 | 768 | 94 | 740 |
| 2013 | 734 | 776 | 95 | 743 |
| 2014 Q1 | 766 | 790 | 97 | 765 |
| 2014 Q2 | 756 | 782 | 97 | 751 |
| 2014 Q3 | 756 | 797 | 95 | 749 |
| 2014 Q4 | 766 | 796 | 96 | 760 |
| 2015 Q1 | 799 | 802 | 100 | 799 |
In the first quarter, for the first time in history, the median asking rent equaled the entire weekly earnings of the median worker.
Even worse, the median wage of all workers does not quite accurately capture the median wage of renters, since they tend to be from lower income groups. And as the graph below compiled by the Employment Law Project from last August shows, the median real wage of the 4th and 5th quintile as of then had declined more than the median real wage of workers overall compared with their 2009 peak:
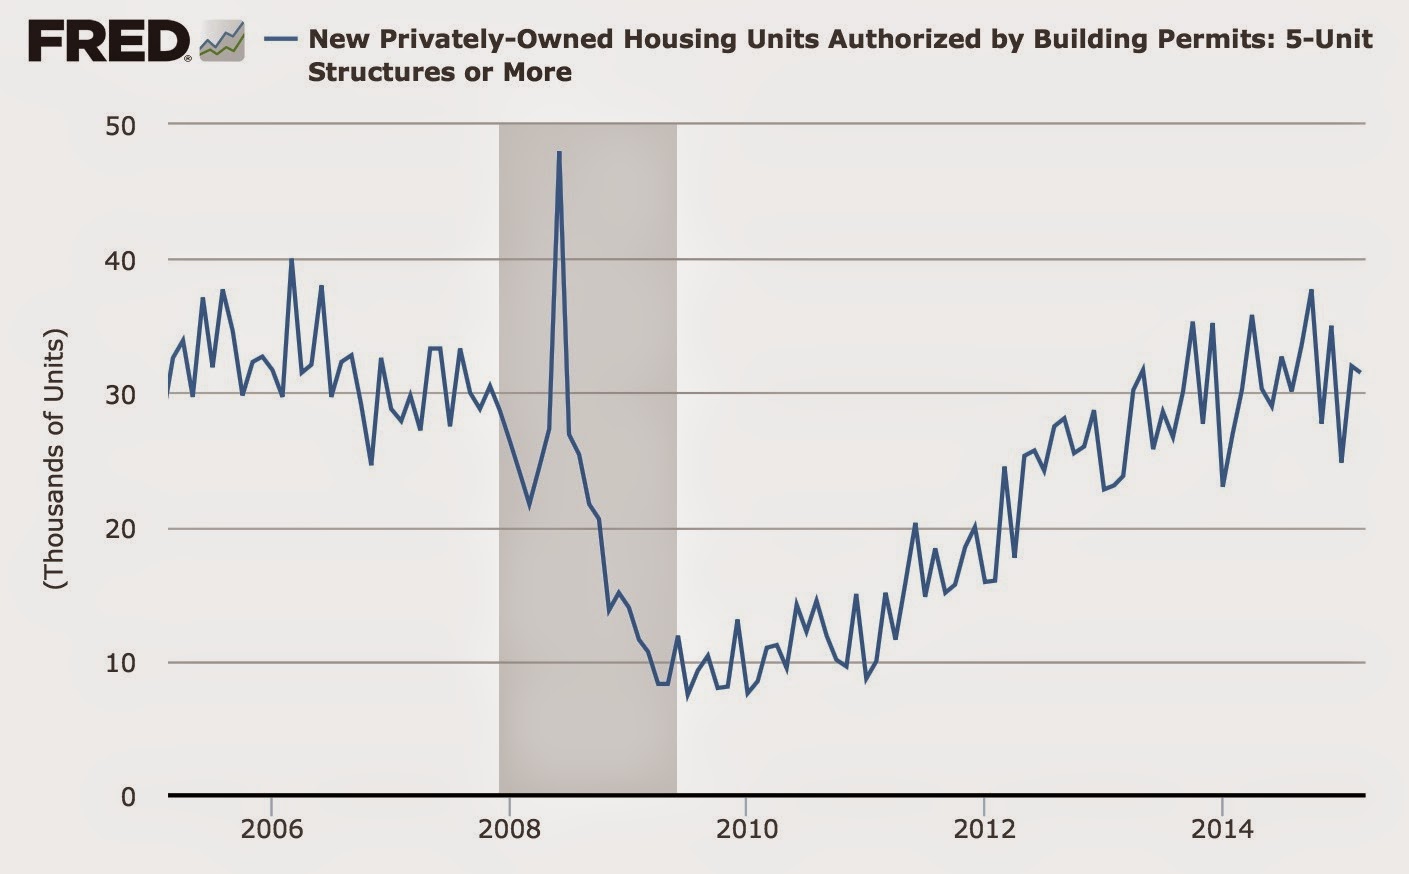
Looking at multi-unit housing construction helps us distill some signal from the noise. First of all, after booming in earlier 2014, apartment construction has declined slightly:
A second important point is the regional difference in the data. Below is a portion of the Census Bureau's table showing median asking rents nationwide (1st column), and broken down by regions: Northeast (2nd column), Midwest (3rd), South (4th), and West (5th):
As you can see, the lion's share of the increase in the 1st quarter was a nearly 10% increase in asking rents in the Western region. As the chart below shows, the West also has the lowest vacancy rate of any of the regions (although the Northeast is also very low):
It's certainly possible that the spike in rents in the Western region is noise due to small sample size, but a comparison of housing permits in the West vs. the Northeast, both of which regions have especially low vacancy rates, shows that from miid-2013 to mid-2014, in all but one quarter issuance of permits slowed more in the West than in the Northeast:
Given the lag in completions of apartment buildings after permits are issued, this is what I would expect given the jump in rental prices in the West.
I do expect that some of the spike in asking rents int he first quarter will prove to have been noise, but it is unwelcome nevertheless. But with low vacancy rates, the big increase in rents, and the continuing tailwind of Millennial household formation, I expect the slowdown in apartment construction to be transitory.


