Tuesday, November 16, 2010
What do the Harbingers of the May slowdown say now?
- by New Deal democrat
In a post at the beginning of the summer, I identified 7 harbingers of the second half stall. With Euro Crisis two prominent in the news, along with the Shanghai market crash, it is worthwhile to see what the harbingers are showing now. I don't have time to post graphs, but here is the list:
Harbingers which have turned down:
Shanghai stock index - 10% crash in 2 days. Who sez QE2 isn't having its desired effect?!?
Oil prices at 4% of GDP - Oil came very close to $90 again within the last 2 weeks
Harbingers that have not confirmed a slowdown:
Bond yields correlation with stock prices - these are still moving as mirror images, not in tandem, indicating no concern of deflation
Real M1 and M2 money supply stagnant or shrinking - to the contrary, both had pretty strong growth in October
Libor index rising - this is probably the most telling harbinger of all. Not only is it still asleep, it has actually declined in the last couple of weeks. There is ZERO anticipation of banking stress evident.
Harbingers that are unknown:
Price growth exceeded wage growth - These are only current through September at present. CPI is anticipated to increase about .3% for October, and this is likely to be more than wage growth.
Decline in housing permits and purchase mortgage applications - purchase mortgage applications are trending sideways and permits are due out tomorrow. They are also expected to trend sideways.
In summary, the signs are not aligning to confirm another stall as of now.


K.I.S.S. says ... the Boring Recovery
- by New Deal democrat
For the last few years, predicting the economy has been like predicting an out of control roller coaster on quantum eleven dimensional tracks -- in the twilight zone! Now, with the housing bubble busted, the Wall Street financial bubble exploded, nearly 8 million jobs lost in one year alone, followed by a stimulus fueled V-shaped GDP recovery with almost all other indicators sooner or later coming along for the ride (except, most conspicuously, for income), followed by the double dip of doom that disappointed .... for the last couple of months the economy has seemed to be in a real lull.
Let's just do a basic check of the K.I.S.S. method of looking into the near economic future, the boring ol' Leading Economic Indicators. Here's what they looked like through last month:
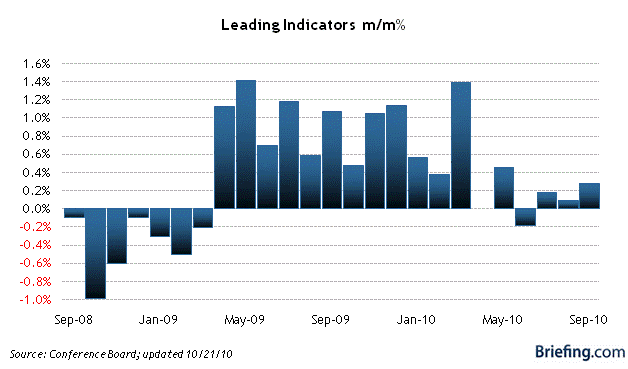
Predictions for the release this Thursday for October have been slightly raised from +.5 to +.6. Those numbers may not be exactly correct, but it is hard to argue with a significant positive number being released:
The yield curve in bonds remains reasonably strongly positive
Real M1 and M2 should both show solid gains
The stock market in the last 3 months has rallied about 10%
New jobless claims have decreased
Durable goods have increased
Nondurable goods have increased
Hours worked in manufacturing went up last month
Consumer confidence about the future went up
On the other hand, vendor deliveries in the ISM manufacturing survey have gone down, confirming the ample signs that manufacturing is slowing down.
Permits are not yet known, but are not expected to show a big shift
In short, we should get our fourth positive reading in a row, and the highest 3 month average in about half a year.
Since the LEI are meant to predict 3 to 6 months into the future, the slowdown of spring, with a zero reading in May and a negative reading in July, should either have passed maximum impact already, or be close to maximum effect now. Yet the economy, as of the last GDP reading, has increased about 3% in real terms in the last 12 months -- approximately long term trend growth. Payrolls last month increased just enough to absorb population growth. Retail sales, needless to say, have been doing quite well for the last 4 months. Construction is bouncing along the bottom.
The LEI tell us to expect more or less the same over the next 3 to 6 months. Boring, positive, growth, either at trend or a little under trend.
Put another way, good -- just not good enough, coming out of the worst recession since the 1930's.
P.S. For the reasons discussed above, I am not terribly worried by this morning's Industrial Production and Capacity Utilization reports. They are the coincident reflections of the LEI's convergeance towards zero at midyear. IP in particular seems to follow retail sales with a short delay, and it is now correcting for its overshoot of retail sales during the summer -- in short, a classic inventory correction that was telegraphed by the declining ISM vendor deliveries series which is a component of the LEI.
P.P.S. Via Prof. Mark Thoma, his U. of Oregon colleague Prof. Tim Duy makes the same point I am making in this post, using retail sales as a proxy.
For the last few years, predicting the economy has been like predicting an out of control roller coaster on quantum eleven dimensional tracks -- in the twilight zone! Now, with the housing bubble busted, the Wall Street financial bubble exploded, nearly 8 million jobs lost in one year alone, followed by a stimulus fueled V-shaped GDP recovery with almost all other indicators sooner or later coming along for the ride (except, most conspicuously, for income), followed by the double dip of doom that disappointed .... for the last couple of months the economy has seemed to be in a real lull.
Let's just do a basic check of the K.I.S.S. method of looking into the near economic future, the boring ol' Leading Economic Indicators. Here's what they looked like through last month:
Predictions for the release this Thursday for October have been slightly raised from +.5 to +.6. Those numbers may not be exactly correct, but it is hard to argue with a significant positive number being released:
The yield curve in bonds remains reasonably strongly positive
Real M1 and M2 should both show solid gains
The stock market in the last 3 months has rallied about 10%
New jobless claims have decreased
Durable goods have increased
Nondurable goods have increased
Hours worked in manufacturing went up last month
Consumer confidence about the future went up
On the other hand, vendor deliveries in the ISM manufacturing survey have gone down, confirming the ample signs that manufacturing is slowing down.
Permits are not yet known, but are not expected to show a big shift
In short, we should get our fourth positive reading in a row, and the highest 3 month average in about half a year.
Since the LEI are meant to predict 3 to 6 months into the future, the slowdown of spring, with a zero reading in May and a negative reading in July, should either have passed maximum impact already, or be close to maximum effect now. Yet the economy, as of the last GDP reading, has increased about 3% in real terms in the last 12 months -- approximately long term trend growth. Payrolls last month increased just enough to absorb population growth. Retail sales, needless to say, have been doing quite well for the last 4 months. Construction is bouncing along the bottom.
The LEI tell us to expect more or less the same over the next 3 to 6 months. Boring, positive, growth, either at trend or a little under trend.
Put another way, good -- just not good enough, coming out of the worst recession since the 1930's.
P.S. For the reasons discussed above, I am not terribly worried by this morning's Industrial Production and Capacity Utilization reports. They are the coincident reflections of the LEI's convergeance towards zero at midyear. IP in particular seems to follow retail sales with a short delay, and it is now correcting for its overshoot of retail sales during the summer -- in short, a classic inventory correction that was telegraphed by the declining ISM vendor deliveries series which is a component of the LEI.
P.P.S. Via Prof. Mark Thoma, his U. of Oregon colleague Prof. Tim Duy makes the same point I am making in this post, using retail sales as a proxy.
The Stupidity of the Republican QEII Response
I am now thoroughly convinced there is a place in Washington DC where all politicians go to have a lobotomy. It doesn't matter what party they are members of; all politicians who go to DC are quickly lobotomized. I should add -- I think this also applies at the state level, but am unsure if it's every state (at least, yet). The mass lobotomy theory is the only answer to the abject stupidity of the ideas that are getting floated right now.
From the WSJ:
From the WSJ:
A group of prominent Republican-leaning economists, coordinating with Republican lawmakers and political strategists, is launching a campaign this week calling on Fed Chairman Ben Bernanke to drop his plan to buy $600 billion in additional U.S. Treasury bonds.The economists have been consulting Republican lawmakers, including incoming House Budget Committee Chairman Paul Ryan of Wisconsin, and began discussions with potential GOP presidential candidates over the weekend, according to a person involved.
Let's start with a basic look at inflation, keeping in mind we've already seen a round of quantitative easing.

The chart above is from the St. Louis Federal Reserve, and it shows the month to month increase in CPI. Notice that since the end of the recession the month to month increase in inflation has been at more or less the same level as it was before the recession. In other words, QE1 has not had much of an impact on inflation. Got that? After one round of QE we have not seen a massive increase in inflation.

Above is a chart of the year over year percentage change in inflation. Notice that -- like the month to month numbers -- this has also been pretty tame, in fact coming in lower than the numbers before the recession.
So -- after one round of quantitative easing, we're OK on the inflation front.
But Bonddad! They're going to flood the market with money! The dollar will become worthless! At this juncture, it would be really helpful if the people commenting on Fed policy would stand-up and explain how the Federal Reserve works. Because in doing so, they would immediately prove that they know JACK about what is really going on.
I've explained this before, but it's obvious that people didn't learn. So, let's go over this again (however, there will be BIG WORDS that you might have to look up):
1.) Yes, the Fed is purchasing trillions of dollars of Federal debt. And, yes, this is probably a primary reason for lower interest rates. And, yes, this has led to an increase in the monetary base, or:
In economics, the monetary base (also base money, money base, high-powered money, reserve money, or, in the UK, narrow money) is a term relating to (but not being equivalent to) the money supply (or money stock), the amount of money in the economy. The monetary base is highly liquid money that consists of coins, paper money (both as bank vault cash and as currency circulating in the public), and commercial banks' reserves with the central bank
So yes, the monetary base is increasing. In fact, it has increased substantially, as demonstrated by this chart:

BUT THAT IS HALF OF THE STORY. In order for that chart to lead to inflation, banks have to lend out the money. And loan demand is weak, leading to an overall decrease in loans:

However, let's confirm that fact and look at a picture of money supply, specifically, MZM, which is:
A measure of the liquid money supply within an economy. MZM represents all money in M2 less the time deposits, plus all money market funds......
MZM has become one of the preferred measures of money supply because it better represents money readily available within the economy for spending and consumption. This measurement derives its name from its mixture of all the liquid and zero maturity money found within the three "M's."
Here is a chart of the year over year percentage change in MZM

The above chart goes to 1960. Notice that the current rate of the year over year percentage change is barely positive. In other words, this is not inflationary. In addition, notice that MZM's velocity is near 40 year lows:

This means that money is moving through the market really slowly -- as in at nearly the slowest level in the last 40 years.
In other words, the fear from Mike Pence and his uneducated bunch of yahoos is baseless, groundless and completely devoid of any connection to reality.
BTW -- if you want to really learn about this stuff, read a pamphlet titled Modern Money Mechanics (PDF).
It's a really good read. And if you read it, you'll be many steps ahead of most idiots in Washington.
Yesterday's Market

Let's start with a look at the IEFS -- the 7-10 year Treasury ETF. Yesterday, prices broke through support (a) on a big gap down (b). The next level of support is at (c). Also note the changing EMA picture: the 10 and 20 day EMAs are moving lower and the 10 has moved below the 50 day EMA. Both of these are negative developments.

The daily chart of the IEF shows that prices are in a clear down (a), up (b) down (c) pattern over the last 10 days.

On the IEF daily chart, the technicals are all negative. Money is flowing out of the market (a and b) and momentum is turning negative (c).

For the TLTs, we see another downtrend (a). For the last 10 days, notice the strength of some of the downward bars (c) -- prices are printing strong downward movement. In addition, the 10, 20 and 50 day EMA are now all moving lower with the shorter EMAs below the longer EMAs (b).

The daily chart of the TLTs shows that technical developments are negative. Money is flowing out of the market (a and b) and momentum is clearly negative (c).
The long end of the Treasury market is clearly selling off now.

Yesterday, stock prices opened slightly higher (a), but then consolidated in a triangle pattern (b) before moving higher (c). Note that prices formed one downward pennant pattern (d). Right after lunch prices broke key support (e) and then moved lower (f), forming two upward consolidation patterns that found resistance at the EMAs (g).
Monday, November 15, 2010
Are Things Getting Better for Small Business?
From Bloomberg:
Small businesses are bouncing back as access to lending eases and consumers ramp up purchases. This would be welcome news for policy makers struggling to spur the world’s largest economy and bring down unemployment stalled near a 26-year high, because small companies account for 60 percent of job creation, according to Federal Reserve Chairman Ben S. Bernanke. The Fed said Nov. 3 it plans to buy another $600 billion of Treasuries, citing “disappointingly slow” progress in the recovery.
“The winds are changing in favor of small businesses,” said Ryan Sweet, senior economist at Moody’s Analytics Inc. in West Chester, Pennsylvania. “It is a gradual improvement, but they’re definitely more active than they were a few months ago. As these businesses re-engage, it’ll put the recovery on a more solid footing.”
.....
“This looks to us like the start of a serious improvement,” Ian Shepherdson, chief U.S. economist at High Frequency Economics Ltd. in Valhalla, New York, said in a note to clients after the NFIB report on Nov. 9. “We have long argued that a proper recovery in the broad economy requires a sustained improvement in the small-firm sector, which employs half the workforce.”
A month earlier, Shepherdson had written that September NFIB data indicated “progress is slow and small firms remain deeply depressed.”
.....
One source of relief for small companies is the thaw in lending, reinforced by the Fed’s quarterly survey of senior loan officers, released Nov. 8. Fed officials have held more than 40 meetings this year to try to reverse the drop in credit, and Bernanke said in an Oct. 15 speech that regulators have “seen some positive signs.”
Retail Sales Good; Empire State VERY Bad
According to the Census Bureau, retail sales increase 1.2% last month,
Let's take a closer look at the data.

First, auto sales were up 5% -- a really good number. In addition, building materials and gardening supplies increased 1.9% -- also a good number, especially becuase it relates to the housing sector. Clothing increased .7% and sporting/hobby purchases increased 1%. Simply put, this report indicates the consumer was very active last month.
However, the Empire State manufacturing report was downright ugly:
Here's a chart of the data.

Simply put, this number stinks. While the Eastern seaboard manufacturing numbers have been poor for the last few months, a drop of this magnitude was unexpected.
Let's take a closer look at the data.

First, auto sales were up 5% -- a really good number. In addition, building materials and gardening supplies increased 1.9% -- also a good number, especially becuase it relates to the housing sector. Clothing increased .7% and sporting/hobby purchases increased 1%. Simply put, this report indicates the consumer was very active last month.
However, the Empire State manufacturing report was downright ugly:
The Empire State Manufacturing Survey indicates that conditions deteriorated in November for New York State manufacturers. For the first time since mid-2009, the general business conditions index fell below zero, declining 27 points to -11.1. The new orders index plummeted 37 points to -24.4, and the shipments index also fell below zero. The indexes for both prices paid and prices received declined, with the latter falling into negative territory. The index for number of employees remained above zero but was well below its October level, and the average workweek index dropped to -13.0. Future indexes generally climbed, suggesting that conditions were expected to improve in the months ahead, although the capital spending and technology spending indexes inched lower.
.....
The general business conditions index fell below zero for the first time since July of 2009, dropping a steep 27 points to -11.1—an indication that, on balance, conditions had worsened over the month. The percentage of respondents reporting that conditions had improved fell from 35 percent in October to just 17 percent in November, while the percentage reporting that conditions had worsened rose from 20 percent to 28 percent. The new orders index plummeted 37 points to -24.4, its sharpest drop since September 2001. Nearly 40 percent of respondents reported that orders were down. The shipments index fell 26 points to -6.1, and the unfilled orders index declined 23 points to -24.7. The delivery time index, at -9.1, was little changed. The inventories index rose to zero after dropping into negative territory last month.
Here's a chart of the data.

Simply put, this number stinks. While the Eastern seaboard manufacturing numbers have been poor for the last few months, a drop of this magnitude was unexpected.
Regarding the Deficit Commission's Report
Neither NDD nor I liked the report issued by the deficit reduction committee. I commented that it was premised on a faulty idea: tax simplification. NDD also noted this had been done before. He also noted the structure proposed would lead to Social Security's further being a target of cutting because of its overall structure.
However, there are a few points that do need to be made. First, the budget does need to come under far more control. Consider the following two charts:

In 1969, non-discretionary spending accounted for 36% of federal outlays.

Now that number is 61%. In other words, the percentage of the Federal Budget that we have control over is shrinking pretty quickly. This is the primary reason we have to do something.
But -- the problem is medical spending.

Above is a chart showing the percentages of non-discretionary spending (programmatic spending) as a percentage of GDP. Social Security has been remarkably stable, coming at at between 4% and 5% since 1979. The real culprit is medical spending; medicare has increase from under 1% of GDP in 1969 to over 3% in 2008; over the same period, medicaid has increased from .2% to 1.6%. And medical costs are the real issue going forward. Consider this chart from the CBO:

Now, the real issue here is medical pricing and economics is screwy. Have you ever seen a hospital bill? How do they come up with the prices they charge? In every other area of economics, I can tell you how to get a price; not with medical costs. Simply put, medical economics are a complete mystery.
Kevin Drum first noted and his analysis is right on the mark. Medical expenses have to be dealt with in a serious way.
However, there are a few points that do need to be made. First, the budget does need to come under far more control. Consider the following two charts:

In 1969, non-discretionary spending accounted for 36% of federal outlays.

Now that number is 61%. In other words, the percentage of the Federal Budget that we have control over is shrinking pretty quickly. This is the primary reason we have to do something.
But -- the problem is medical spending.

Above is a chart showing the percentages of non-discretionary spending (programmatic spending) as a percentage of GDP. Social Security has been remarkably stable, coming at at between 4% and 5% since 1979. The real culprit is medical spending; medicare has increase from under 1% of GDP in 1969 to over 3% in 2008; over the same period, medicaid has increased from .2% to 1.6%. And medical costs are the real issue going forward. Consider this chart from the CBO:

Now, the real issue here is medical pricing and economics is screwy. Have you ever seen a hospital bill? How do they come up with the prices they charge? In every other area of economics, I can tell you how to get a price; not with medical costs. Simply put, medical economics are a complete mystery.
Kevin Drum first noted and his analysis is right on the mark. Medical expenses have to be dealt with in a serious way.
Sunday, November 14, 2010
Yesterday's Market

The first big move last week occurred on Tuesday, when prices moved lower for the entire day (a). Prices rebounded on Wednesday, but hit resistance at previous highs (b), which was followed by a lower opening on Thursday (c) and another all day rally (d). Prices gapped lower at the open on Friday (e), rallied into the EMA area (f). and then fell hard (g). Overall, the tone of the market last week was negative, as we had two rallies that had no follow-through and a big sell-off on Friday.

Prices have now retreated to the 20 day EMA for support.

Looking at the daily picture of the SPYs along with the technical indicators, we get the following picture. Prices have hit previous price levels (a) and retreated. This is a healthy development; price movements are like a good musical line -- there should be tension and release. However, we don't want prices to retreat too far. Right now they are at the 20 day EMA, which is a good level. Also note the orientation of all the EMAs; they are very bullish. The shorter are above the longer and all are moving higher. The technical indicators tell us that we're still seeing a net inflow of cash into the market (c and d) but momentum is getting a bit weary (e). Overall -- and considering the news from Friday (China and Ireland) a further downward move is more likely.

The Treasury market saw three primary moves: a downward trend that lasted until mid-day Wednesday (a), a quick rebound (b) that lasted until the close of Wednesday and a sell-off that lasted the rest of the week (c).

Notice how the 200 minute EMA acted as resistance the entire week.

Last week, the dollar made two primary moves. On Tuesday and into Wednesday prices moved higher (a). For the rest of the week, prices consolidated in a rectangle pattern (b).

On the daily chart, notice that prices still appear to be bottoming (a). Also note the 10 day EMA is about to cross over the 20 day EMA -- a bullish development. Money is flowing into the market (c and d) and there is increased upside momentum (e).
Friday, November 12, 2010
Weekend Weimar and Beagle
It's that time of the week. Don't think about anything related to the economy or the markets until Monday. Until then ...


Weekly Indicators: I hear catfood tastes yummy Edition
- by New Deal democrat
And so, at long last, in the last 10 days Barack Obama, who soared into office on the most brilliant intellect since John Quincy Adams and the most inspiring rhetoric since Ronald Reagan, has revealed himself as having the compassion of Herbert Hoover and the negotiating skills of Jimmy Carter. His "deficit commission" proposes *lowering* the tax rates on corporations and the wealthy, leaves Wall Street completely unscathed, and places almost all of the burden of balancing the budget on the backs of middle class households earning between $50,000 and $120,000 a year.
Tax rate simplification was tried in 1986. It lasted less than 6 years, by the end of which it was once again riddled with exemptions and loopholes. Only those who do not remember their history can believe it is worthwhile to repeat it. By turning Social Security into a welfare program for the lower 40%, paid for by the remaining 60%, the panel has ensured that there will be a powerful and growing constituency favoring its further destruction in 10 or 20 years. All this over a shortfall that, as Bruce Webb tirelessly points out, can be completely covered by a 1/2% increase in payroll taxes.
The rancid icing on the poison cake is the White House's capitulation on the issue of making the Bush tax cuts for the wealthy - the single biggest source of the persistent budget deficit and burgeoning national debt - permanent.
I was going to post an economic outlook yesterday, but in the midst of the biggest government inflicted catastrophe on the middle class in over 75 years, it seemed hardly worthwhile.
Here is this week's high frequency data:
The price of a barrel of Oil held steady at about $86 a barrel. If Oil goes over $90 and stays there, we will probably go right back down into a recession in a few months. Gas at the pump remained stable at $2.82 a gallon. Gasoline usage was exactly the same as one year ago, at 9.015. Gasoline stocks are down considerably, to no more than 5% above their normal range for this time of year.
Meanwhile the Mortgage Bankers' Association reported that its seasonally adjusted Purchase Index increased another 5.5% last week, the third straight week of increase. Purchase applications have stabilized generally in the last few months at a level about 20% lower than 2009. Meanwhile, the Refinance Index increased 6.0% from the previous week. Refinancing is still proceeding at a generally high rate.
The ICSC reported same store sales for the week ending November 6 increased 1.3% week over week, and also increased 3.4% YoY, the best comparison in over a month. Shoppertrak did not report for the week, and did report that sales were up only 1.6% YoY for the month of October. October's retail sales report, due Monday morning, will be the most important statistic next week.
The BLS reported 435,000 new claims, the lowest in over 2 years. The 4 week average has finally moved below 450,000. Next week will see if there is a new trend towards lower claims out of the 12 month range or not, the second big statistic of the week.
Railfax for the first time in a long time showed outright decline compared with last year's loads for all sectors. Some of this may be due to retailers ordering and receiving holiday goods early, after last year some were left without merchandise due to shipping delays, but we will see.
The American Staffing Association reported that for the week ending November 2, temporary and contract employment slipped 0.26 back to 100.0. Seasonality, in which temp help stabilizes and then declines in late December is probably the dominant factor at the moment.
M1 increased .9% last week, and was up 0.7% month over month, and up 5.7% YoY, hence “real M1” is up 4.6%. M2 declined .1% last week, but increased +0.6% month over month, and increased 3.3% YoY, so “real M2” is up 2.2%.
Weekly BAA commercial bond rates increased 0.04% last week to 5.80%. This compares with yields on 10 year bonds up +.13%. Thus there is no sign of buyers seeing increased default risk in B rated corporate bonds.
The Daily Treasury Statement showed $50.9 B in receipts vs. $47.4 B a year ago, a gain of about 7.2% for the first 7 days of November. For the last 20 days, receipts are up $125.2 B vs. $118.7 B a year ago, a gain of about 5.5%. Seasonality is beginning to be felt in the early November numbers.
In the short term, if Oil and a new Euro crisis do not again threaten the recovery (shades of May), the recovery still appears on track.
In the longer term, if G^d is still willing to show mercy on the country, then just as Lyndon Johnson - whose domestic legislative record of the voting rights act, civil rights act, immigration reform, and Medicare and Medicaid could not withstand the divisions of his Vietnam escalation - chose not to seek re-election in 1968, so Barack Obama may voluntarily step aside in 2012.
And so, at long last, in the last 10 days Barack Obama, who soared into office on the most brilliant intellect since John Quincy Adams and the most inspiring rhetoric since Ronald Reagan, has revealed himself as having the compassion of Herbert Hoover and the negotiating skills of Jimmy Carter. His "deficit commission" proposes *lowering* the tax rates on corporations and the wealthy, leaves Wall Street completely unscathed, and places almost all of the burden of balancing the budget on the backs of middle class households earning between $50,000 and $120,000 a year.
Tax rate simplification was tried in 1986. It lasted less than 6 years, by the end of which it was once again riddled with exemptions and loopholes. Only those who do not remember their history can believe it is worthwhile to repeat it. By turning Social Security into a welfare program for the lower 40%, paid for by the remaining 60%, the panel has ensured that there will be a powerful and growing constituency favoring its further destruction in 10 or 20 years. All this over a shortfall that, as Bruce Webb tirelessly points out, can be completely covered by a 1/2% increase in payroll taxes.
The rancid icing on the poison cake is the White House's capitulation on the issue of making the Bush tax cuts for the wealthy - the single biggest source of the persistent budget deficit and burgeoning national debt - permanent.
I was going to post an economic outlook yesterday, but in the midst of the biggest government inflicted catastrophe on the middle class in over 75 years, it seemed hardly worthwhile.
Here is this week's high frequency data:
The price of a barrel of Oil held steady at about $86 a barrel. If Oil goes over $90 and stays there, we will probably go right back down into a recession in a few months. Gas at the pump remained stable at $2.82 a gallon. Gasoline usage was exactly the same as one year ago, at 9.015. Gasoline stocks are down considerably, to no more than 5% above their normal range for this time of year.
Meanwhile the Mortgage Bankers' Association reported that its seasonally adjusted Purchase Index increased another 5.5% last week, the third straight week of increase. Purchase applications have stabilized generally in the last few months at a level about 20% lower than 2009. Meanwhile, the Refinance Index increased 6.0% from the previous week. Refinancing is still proceeding at a generally high rate.
The ICSC reported same store sales for the week ending November 6 increased 1.3% week over week, and also increased 3.4% YoY, the best comparison in over a month. Shoppertrak did not report for the week, and did report that sales were up only 1.6% YoY for the month of October. October's retail sales report, due Monday morning, will be the most important statistic next week.
The BLS reported 435,000 new claims, the lowest in over 2 years. The 4 week average has finally moved below 450,000. Next week will see if there is a new trend towards lower claims out of the 12 month range or not, the second big statistic of the week.
Railfax for the first time in a long time showed outright decline compared with last year's loads for all sectors. Some of this may be due to retailers ordering and receiving holiday goods early, after last year some were left without merchandise due to shipping delays, but we will see.
The American Staffing Association reported that for the week ending November 2, temporary and contract employment slipped 0.26 back to 100.0. Seasonality, in which temp help stabilizes and then declines in late December is probably the dominant factor at the moment.
M1 increased .9% last week, and was up 0.7% month over month, and up 5.7% YoY, hence “real M1” is up 4.6%. M2 declined .1% last week, but increased +0.6% month over month, and increased 3.3% YoY, so “real M2” is up 2.2%.
Weekly BAA commercial bond rates increased 0.04% last week to 5.80%. This compares with yields on 10 year bonds up +.13%. Thus there is no sign of buyers seeing increased default risk in B rated corporate bonds.
The Daily Treasury Statement showed $50.9 B in receipts vs. $47.4 B a year ago, a gain of about 7.2% for the first 7 days of November. For the last 20 days, receipts are up $125.2 B vs. $118.7 B a year ago, a gain of about 5.5%. Seasonality is beginning to be felt in the early November numbers.
In the short term, if Oil and a new Euro crisis do not again threaten the recovery (shades of May), the recovery still appears on track.
In the longer term, if G^d is still willing to show mercy on the country, then just as Lyndon Johnson - whose domestic legislative record of the voting rights act, civil rights act, immigration reform, and Medicare and Medicaid could not withstand the divisions of his Vietnam escalation - chose not to seek re-election in 1968, so Barack Obama may voluntarily step aside in 2012.
The German Economy is Recovered
From the WSJ:
The German economy's transformation from spluttering Trabant to purring Mercedes is complete.Although third-quarter gross domestic product growth of 0.7% was slightly below consensus, that was made up for by revisions higher for the first half of the year; the country is on track to grow 3.5% or more in 2010, its best performance since reunification and far above the 1.5% average in the precrisis decade. Crucially, domestic demand, both private and public, is now making an equal contribution to growth with investment and exports, suggesting the economy is rebalancing naturally, despite misplaced criticism from some trading partners.
Germany's GDP has now recovered more than 70% of the 6.6% fall in output as a result of the recession, J.P. Morgan Chase & Co. notes. Both companies and individuals are upbeat. With German bond yields so low and no fiscal concerns, the cost of borrowing is cheap. The latest survey by the German Chambers of Industry and Commerce showed a positive balance of 14% of companies planning to increase investment, far above the long-run average of minus 8% and close to a record; a similar picture emerges for hiring intentions. Unemployment has fallen below three million, its lowest level since 1992.
The Real Issues With QEII
There has been a fair amount of ink, stating that several countries have jumped on the Fed's back about QEII. Consider the following:
Several other countries have voiced their concern, largely about the increase of foreign inflows, which drive up the value of their respective currencies, hurting their exports and thereby lowering growth.
So -- let's ask a basic question: what exactly is currency manipulation? And more importantly, how do you separate it from a central bank's interest rate policy? For example, central banks lower interest rates to get countries out of a recession; that's central banking 101. But lowering rates also lowers the value of the country's currency, making their exports more attractive in other countries. Other countries view this negatively, because now their products are less competitive relative to the now devalued currency. However, the lowering of currency values is to be expected and is a by-product of the action; it's also a central element of a free floating currency system.
In addition, in a free-floating currency system, the values of the respective currencies should theoretically reflect the state of the underlying economy. For example, when a country starts to recover, international investors will want to put more money into that country. This drives up the value of the currency. So -- as the economy improves, the currency's value rises, which acts as a natural brake on the economy. The converse is true of a country in a recession; it's currency becomes less attractive and valuable, making its exports more attractive, which in turn helps the country get out of the recession.
That, of course, assumes the system is not rigged somehow. Now we return to the original point: what is currency manipulation? First, I would reject the notion that central bank interest rate policy is currency manipulation and should be treated as such. While interest rate policy has an impact on currency values, it is not the central purpose of the policy, which instead is used to spur economic growth or "tap on the breaks" to slow inflationary pressures.
As for QEII, or similar programs, we move into somewhat murkier territory, although it's also important to remember the economic backdrop against which these policies are implemented. The Fed's program is occurring at a time of slow growth and high unemployment; it's extremely doubtful they would engage in this policy in a 4% GDP growth and 5% unemployment environment. As such, this is primarily an economic program, not a currency manipulation program.
But that doesn't mean the currency dimension should not be considered at all. The big problem with the dollar is it happens to be one of the world's reserve currencies. In addition, all commodities are priced in dollars, adding further complications. This is, I think, at the core of at least part of the concern regarding QEII: a dollar devaluation is naturally inflationary because commodities are priced in dollars.
In reality, I believe the real question being asked is this: do we need a new international commodity price/currency system, where commodities are priced against a basket of primary currencies rather than just the dollar? I would answer yes, that would be an extremely good idea.
Global controversy mounted over the Federal Reserve's decision to pump billions of dollars into the U.S. economy, with President Barack Obama defending the move as China, Russia and the euro zone added to a chorus of criticism.
.....
The G-20 summit that begins Wednesday night in Seoul is shaping up as a showdown between exporting powers, such as Germany and China, and nations such as the U.S. that are struggling to emerge from recession and high unemployment.
The G-20 summit that begins Wednesday night in Seoul is shaping up as a showdown between exporting powers, such as Germany and China, and nations such as the U.S. that are struggling to emerge from recession and high unemployment.
Several other countries have voiced their concern, largely about the increase of foreign inflows, which drive up the value of their respective currencies, hurting their exports and thereby lowering growth.
So -- let's ask a basic question: what exactly is currency manipulation? And more importantly, how do you separate it from a central bank's interest rate policy? For example, central banks lower interest rates to get countries out of a recession; that's central banking 101. But lowering rates also lowers the value of the country's currency, making their exports more attractive in other countries. Other countries view this negatively, because now their products are less competitive relative to the now devalued currency. However, the lowering of currency values is to be expected and is a by-product of the action; it's also a central element of a free floating currency system.
In addition, in a free-floating currency system, the values of the respective currencies should theoretically reflect the state of the underlying economy. For example, when a country starts to recover, international investors will want to put more money into that country. This drives up the value of the currency. So -- as the economy improves, the currency's value rises, which acts as a natural brake on the economy. The converse is true of a country in a recession; it's currency becomes less attractive and valuable, making its exports more attractive, which in turn helps the country get out of the recession.
That, of course, assumes the system is not rigged somehow. Now we return to the original point: what is currency manipulation? First, I would reject the notion that central bank interest rate policy is currency manipulation and should be treated as such. While interest rate policy has an impact on currency values, it is not the central purpose of the policy, which instead is used to spur economic growth or "tap on the breaks" to slow inflationary pressures.
As for QEII, or similar programs, we move into somewhat murkier territory, although it's also important to remember the economic backdrop against which these policies are implemented. The Fed's program is occurring at a time of slow growth and high unemployment; it's extremely doubtful they would engage in this policy in a 4% GDP growth and 5% unemployment environment. As such, this is primarily an economic program, not a currency manipulation program.
But that doesn't mean the currency dimension should not be considered at all. The big problem with the dollar is it happens to be one of the world's reserve currencies. In addition, all commodities are priced in dollars, adding further complications. This is, I think, at the core of at least part of the concern regarding QEII: a dollar devaluation is naturally inflationary because commodities are priced in dollars.
In reality, I believe the real question being asked is this: do we need a new international commodity price/currency system, where commodities are priced against a basket of primary currencies rather than just the dollar? I would answer yes, that would be an extremely good idea.
Thursday, November 11, 2010
Yesterday's Market

As I noted a few days ago, prices for the SPY's moved lower after breaking through resistance and are now testing the 10 day EMA for technical support.

The market opened lower (a) but found support at previous levels (b) rallied to the 20 minute EMA and then traded lower (c) before moving through the 10 and 20 minute EMAs only to hut resistance at the 50 minute EMA (d). Prices moved lower m bit then rallied strongly in the afternoon (e). Prices broke support (f), clustered around the 200 minute EMA, before selling off and then rallying into the end (g).

Also note that prices had an upward trend bias for most of the day (a).

The Treasury market was closed yesterday.
Copper Hits a Record
From the WSJ:
Copper prices hit a record, as the seemingly relentless pace of Chinese demand and a potential supply shock from Chile bring the industrial metal's near-term scarcity into stark relief.China, the world's No. 1 consumer of the red metal, released data showing that industrial output and capital spending were holding steady even though Beijing has recently taken steps to cool investment in real-estate and other sectors.
There is an increasing amount of information coming from China that may thwart this upward move in commodities purchased by the Chinese industrial base. The big one is inflation:
China's consumer price index rose 4.4% from a year earlier in October, as food prices drove the fastest increase in two years. Price rises accelerated sharply from the 3.6% increase in September and beat market expectations of a 4% gain. Average inflation for the year has now reached 3% and is likely to march higher unless the readings slow sharply in the next two months.
This has a lot of people concerned that we'll see the Chinese central bank raise rates soon.
Will Oil Threaten the Recovery (Again)?
From Marketwatch:
Crude-oil futures settled at their highest in more than two years Wednesday, defying a rising dollar as a U.S. government report showed a larger-than-expected drop in inventories.Crude for December delivery added $1.09, or 1.3%, to $87.81 a barrel on the New York Mercantile Exchange. That’s oil’s best settlement since early October 2008.
The contract had traded lower just moments before the Energy Information Administration released its update on U.S. petroleum inventories as the dollar continued to rise.
A surprise decline in crude stockpiles for last week brought prices back into positive territory.
The government reported a decline of 3.3 million barrels in the nation’s crude-oil supplies in the week ended Nov. 5. Gasoline stockpiles fell 1.9 million barrels and distillates dropped by 5 million barrels, the Energy Information Administration said.
The update ran counter to analyst expectations of an increase for crude inventories and smaller declines for petroleum products supplies.
Analysts polled by Platts had expected an increase of 2.1 million barrels in stockpiles of crude, while gasoline was seen dropping 1.3 million barrels and distillates were forecast to decline 2 million barrels.
The government’s drawdown of 3.3 million barrels for crude came in smaller than the 7.4 million barrels estimated by the American Petroleum Institute late Tuesday.
Consider this chart:

The lower 80s provided strong resistance for oil prices for the last three months. But over the last week, prices have moved through this important area of resistance. In addition, the EMAs indicate the short and intermediate trends are bullish which is confirmed by the MACD.
Because of oil's central nature to the economy, this is a very important development that needs to be watched closely.
Wednesday, November 10, 2010
The Joke of US Fiscal Policy
From the Economist:
Think about this for a minute. The US is the largest economy in the world. And we have not sent a budget to the floor. That's beyond reckless; that's suicidal. And yet, here we are, waiting for god knows what shoe to drop as the process grinds forward.
Last week, I made this comment about US political parties:
Let me rephrase that. Everyone in Washington -- without exception -- is completely worthless. Please, for the love of God, could you please grow-up and act like adults?
YOU can’t watch the circus that America calls its budget process without suspecting it plays some role in the country's fiscal mess. Congress for the first time has failed to send a budget resolution to the floor, its continuing resolution is about to expire, as are a bunch of tax cuts, and there’s a battle looming over raising the debt ceiling. This does not look like rational fiscal policy.
Think about this for a minute. The US is the largest economy in the world. And we have not sent a budget to the floor. That's beyond reckless; that's suicidal. And yet, here we are, waiting for god knows what shoe to drop as the process grinds forward.
Last week, I made this comment about US political parties:
the Democrats can't lead at all -- they want everybody to get along -- and don't want to hear basic economic information when it runs counter to their narrative, the Republicans have walked away from logic and fact and the Tea Party could care less about mere competence.
Let me rephrase that. Everyone in Washington -- without exception -- is completely worthless. Please, for the love of God, could you please grow-up and act like adults?
Yesterday's Market

Prices dropped at the open (a), but then formed a strong rally for the rest of the day (b). Notice that prices consolidated in a triangle right after their bottom (c) and two other downward sloping pennant patterns.

Prices on the SPYs are moving lower, looking to find support at the 10 day EMA.

Treasuries moved a bit higher at the open (a), but soon moved lower (b), consolidating losses at two junctures (c and d). Prices rallied in the afternoon (e), after which they also consolidated gains (f and g).

The long-end of the Treasury curve has is still below the 200 day EMA, having broken the lower trend line of the downward sloping pennant pattern (a).

The dollar was in a rally for over a day (a), consolidating gains at several junctures (b, c and d). After topping out yesterday morning (e), they moved lower (f), but consolidated losses at the end of trading (g).

The dollar doesn't really have a clear pattern right now. Prices are conglomerating around the 10 and 20 day EMAs. The 10 and 20 have both moved higher, but this is an initial move and needs a great deal of confirmation. The spike in volume indicates a possible selling climax, but with the Fed buying Treasuries, it's hard to see a real reason for a strong rally, save a counter-trend rally.
Budget Panel's Tax Proposals; Completely Unworkable
This is interesting. The deficit reduction commission has released their plan, which is available here.
Here's what I find most interesting:
Here's what I find most interesting:
None of the proposals would take effect next year to avoid disrupting the economic recovery. Bowles said income-tax rates would be reduced to three levels: 8 percent, 14 percent and 23 percent.First, I'm a tax lawyer by profession, so I deal with the code every day. I'm also one of the few people who has actually read pretty much most of the code.Wiping out all tax breaks, including the home mortgage deduction, while lowering rates would save $100 billion a year, Bowles said. Members of the panel could decide to keep some tax breaks by offering offsetting cuts, he said.
Here's what I think they are thinking, which is purely conjecture on my part. If we eliminate all the deductions, then the IRS' compliance burden is greatly reduced. Hence, they lower the cost of tax administration. In addition, I'm thinking the rates they come up with would be the rates the average person in the tax bracket winds up paying anyway. (Again, this is pure conjecture).
While this is a nice idea in theory, there is no way it's going to be implemented. Here's the basic problem: off the top of my head, I'd say at least 35% of all the tax code sections are special interest giveaways. In addition, every year, Congress tinkers with all sorts of aspects of the code, as a sop to some special interest. The only way for this to work is if all the special interest deductions go away -- as in every single one. If you leave in one, then someone else will say, "what about mine? In addition -- none of them can ever come back, because as soon as one comes back, you open the doors to all of them. In other words, the basic premise underlying implementation is politically unworkable.
My initial thought is this is a document full of wonderfully magical thinking -- meaning, it's full of a lot of proposals that will never see the light of day. Basically, it says we can cut taxes and spending and balance the budget.
Current Unemployment Situation Remarkably Similar to Last Three Recoveries
There is understandably a great deal of concern about the current unemployment rate -- what caused it, and especially how long it will take to have it drop to meaningful levels. However, lost in this discussion and concern, is the fact the economy has been in this exact same situation before -- in fact, we've been here after each recession since the mid 1970s recession.

Note that after the mid-1970s recession, unemployment hit 9%. After four years it dropped to 6%, but never hit 5% -- the level most economists use to describe full employment.

After the second recession of the early 1980s, unemployment was nearly 11%. It took over 5 years to get back to "full employment."

After the early 1990s recession, unemployment rose to over 7.5%. Again, it took over five years to get back to full employment.

Although the unemployment rate increased after the early 2000s recession, it didn't hit very high levels. But like the last three recoveries, it took a long time (as in nearly four years) for the unemployment rate to drop.
This commonality with previous recoveries does not make the current situation any easier, and should not be used as justification for doing nothing. However, it is important to remember we've been here before.

Note that after the mid-1970s recession, unemployment hit 9%. After four years it dropped to 6%, but never hit 5% -- the level most economists use to describe full employment.

After the second recession of the early 1980s, unemployment was nearly 11%. It took over 5 years to get back to "full employment."

After the early 1990s recession, unemployment rose to over 7.5%. Again, it took over five years to get back to full employment.

Although the unemployment rate increased after the early 2000s recession, it didn't hit very high levels. But like the last three recoveries, it took a long time (as in nearly four years) for the unemployment rate to drop.
This commonality with previous recoveries does not make the current situation any easier, and should not be used as justification for doing nothing. However, it is important to remember we've been here before.
Subscribe to:
Posts (Atom)