The arguments between the bulls and the bears in the current market has one interesting twist: both are shaving off pieces of the economy and ignoring the rest. The bears for focusing on housing and capital spending while ignoring the employment and wage situation. In contrast the bulls are focusing on employment and wage gains without taking full stock of the housing problems -- or in the least arguing that housing won't spill over because it hasn't yet.
However, I think the bulls have a stronger argument for now simply because they are already in control of the market. The markets have rebounded fairly well from the China sell-off and appear to be moving up still.
That being said, I think the bulls will remain in control for now, assuming the following happens.
1.) Earnings continue to at least meet expectations.
2.) There is no severely negative employment news. For example, last month the BLS reported a gain of 180,000 with upward revisions to previous months. From the bulls perspective, this news will help to fuel wage gains which will drive consumer spending.
3.) The torrid merger and acquisition pace of the last few months continues.
4.) Consumer spending continues in positive territory. Consumers account for 70% of US GDP growth, so their continued spending is vital to keep the economy from falling into a recession. I have been very negative of consumers, largely because of debt levels. However, we have yet to see a level where consumers don't spend. Until we see that, we need to assume the consumer will continue to buy all sorts of stuff.
5.) News of the subprime mortgage problems remain largely contained in the subprime area. If we start to hear a spate of news about prime mortgage defaults increasing or a large number of banks increasing loan loss reserves, than bulls may get skittish. We have already had some news to this effect in the market, but I don't think it's enough to scare the bulls.
Saturday, April 21, 2007
The Bull Argument
Below I express what appears to be the bear's main line of arguments. Here is how the bulls are looking at things.
While GDP growth is slowing, the elements causing the slowdown are contained. The housing slowdown had not severely impacted consumer spending. While personal consumption expenditures slowed in the second and third quarter of 2006 to 2.6% and 2.8% respectively, they accelerated to 4.2% in the 4th quarter.
The main reason for this increase is solid job growth leading to increased disposable income. According to the Bureau of Labor Statistics the US added 180,000 jobs in March and previous months were revised higher. These gains are adding to confidence and bolstering spending. According to the Bureau of Economic Analysis disposable income increased 1.06% in the 4th quarter.
The economy demonstrated it can take the shock of higher oil prices last summer, so the increase in gas prices at the pump won't slow spending this summer.
While GDP growth is slowing, the elements causing the slowdown are contained. The housing slowdown had not severely impacted consumer spending. While personal consumption expenditures slowed in the second and third quarter of 2006 to 2.6% and 2.8% respectively, they accelerated to 4.2% in the 4th quarter.
The main reason for this increase is solid job growth leading to increased disposable income. According to the Bureau of Labor Statistics the US added 180,000 jobs in March and previous months were revised higher. These gains are adding to confidence and bolstering spending. According to the Bureau of Economic Analysis disposable income increased 1.06% in the 4th quarter.
The economy demonstrated it can take the shock of higher oil prices last summer, so the increase in gas prices at the pump won't slow spending this summer.


Liquidity Fueling the Markets
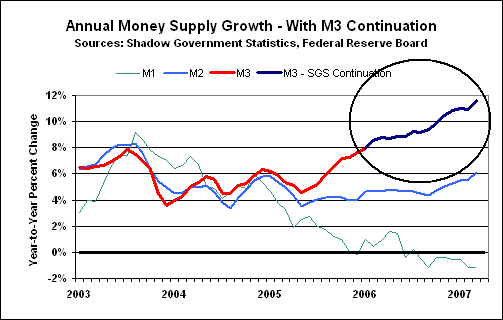
This chart is from a site called Shadow Government Statistics. I can't speak to the veracity of their computations. However, if the chart below is correct -- or even in the ballpark -- we could have an answer for the bull market.
The Bear Argument
I admit it: the current rally is perplexing to me. In an attempt to try and figure out what exactly is going on I'm going to present what I see as the bull and bear market arguments to see which makes the most sense.
The Bear Market
GDP growth is declining. According to the Bureau of Economic Analysis GDP growth for the last three quarters was 2.6%, 2% and 2.5%. Gross Private Domestic Investment was the primary reason for th decline. Residential investment has dropped 11.1%, 18.7% and 19.8% for the last three quarters. While nonresidential investment was positive for the first two of these three quarters, it declined 3.1% in the fourth quarter of 2006.
While personal consumption expenditures have increased, the consumer is heavily indebted. Household debt has increased from 97% of disposable income in 2000 to over 130% in 2006 (this information is from the Federal Reserve's Flow of Funds report). At some point these debt levels will constrain consumer spending, especially with a negative savings rate.
While inflation is not out-of-control, it is above the Fed's stated 1%-2% comfort range. Energy and agricultural prices are under upward price pressure which will prevent inflation from coming down. This in turn will keep the Federal Reserve on the sideline if GDP growth continues to slide.
The Bear Market
GDP growth is declining. According to the Bureau of Economic Analysis GDP growth for the last three quarters was 2.6%, 2% and 2.5%. Gross Private Domestic Investment was the primary reason for th decline. Residential investment has dropped 11.1%, 18.7% and 19.8% for the last three quarters. While nonresidential investment was positive for the first two of these three quarters, it declined 3.1% in the fourth quarter of 2006.
While personal consumption expenditures have increased, the consumer is heavily indebted. Household debt has increased from 97% of disposable income in 2000 to over 130% in 2006 (this information is from the Federal Reserve's Flow of Funds report). At some point these debt levels will constrain consumer spending, especially with a negative savings rate.
While inflation is not out-of-control, it is above the Fed's stated 1%-2% comfort range. Energy and agricultural prices are under upward price pressure which will prevent inflation from coming down. This in turn will keep the Federal Reserve on the sideline if GDP growth continues to slide.
Friday, April 20, 2007
Will International Sales Prevent a Bear Market?
There are a lot of earnings reports coming out right now, and there seems to be a common theme. The US economy is weak, but international sales are keeping earnings going. Just below this article I posted points from Caterpillar's report that showed a big drop in US sales but strong international growth.
While McDonald's saw solid US growth, they also had good numbers from international sales.
Consider the above points in conjunction with the following observations from BCA Research:
This article makes a very prescient observation: growing international markets plus a cheaper dollar mean US companies are now experiencing a similar situation as Asian exporters.
Will this prevent a bear market? I don't know. But, I am seriously considering the implications of these events.
While McDonald's saw solid US growth, they also had good numbers from international sales.
Europe also delivered strong growth in the first quarter, fueled by robust same-restaurant sales across the segment.
Quarterly performance in the Asia/Pacific, Middle East and Africa segment was also strong, as the company cited its "everyday value and locally relevant products driving comparable sales and financial results across the segment."
Consider the above points in conjunction with the following observations from BCA Research:

Today, we present two U.S. equity implication of a soft dollar. First, the S&P growth index is mostly comprised of sectors that have sizable international sales exposure. Importantly, a soft currency makes their products cheaper to foreign customers, a positive development for revenue growth. Meanwhile, the opposite is true for companies in the value benchmark, as their client base is primarily in the U.S. The upshot is that analysts will continue raising relative earnings estimates in favor of growth companies in the coming months. Bottom line: diverging global economic expectations and a weak U.S. dollar bode well for growth over value.
This article makes a very prescient observation: growing international markets plus a cheaper dollar mean US companies are now experiencing a similar situation as Asian exporters.
Will this prevent a bear market? I don't know. But, I am seriously considering the implications of these events.
How Strong is The US Economy
From CBS Marketwatch. This is from a report on Caterpillar's earnings release.
Cat's earnings from outside the US were the reason for the stock's strength today. The news from the US is not that good.
"In North America, sales volume was down significantly from a year earlier," a company statement said. The negative aspects of the quarter included a "significant" decline in housing construction, a slowdown in nonresidential construction and a decline in coal production.
"The steep drop in housing construction continued to depress sales, particularly of smaller machines, as home contractors retrenched. ...Coal mining had a bad first quarter."
North American machinery sales fell by $450 million, or 13%, but rose by $560 million, or 44%, in Europe, Africa and the Middle East.
Cat's earnings from outside the US were the reason for the stock's strength today. The news from the US is not that good.
The Markets Last Week
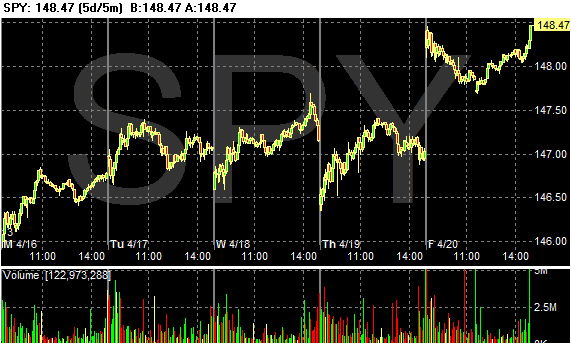
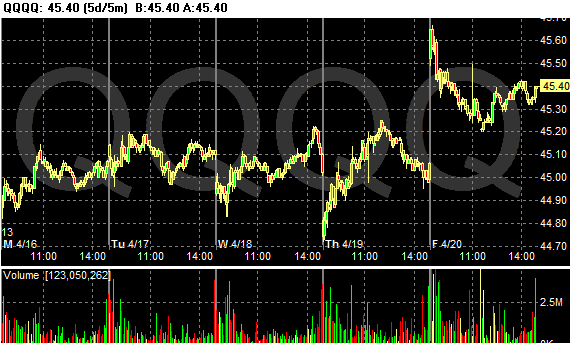
What an odd assortment of weekly charts we have.
The SPYs and QQQQs had a hard time gaining any traction until today (Friday) -- they basically meandered between bulls and bears with no sense of direction. However today they opened higher and basically kept in that position. The QQQQs sold off a bit, but not so much as to endanger the rally.
The IWNs were essentially unchanged for the week, although they had a really big dip yesterday, but got rid of the loss today.
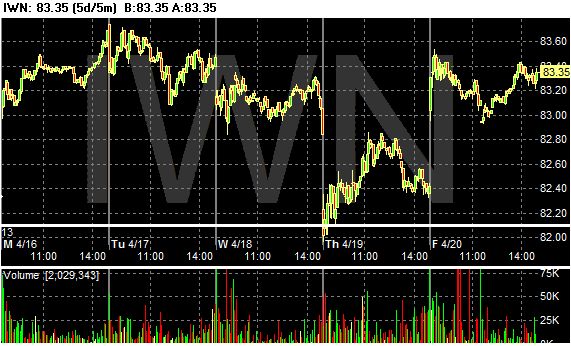
None of these are strong bull market charts. They show the market is susceptible to random events for quick movement, but outside of those moves they are essentially evenly balanced between the bulls and bears.
The SPYs and QQQQs had a hard time gaining any traction until today (Friday) -- they basically meandered between bulls and bears with no sense of direction. However today they opened higher and basically kept in that position. The QQQQs sold off a bit, but not so much as to endanger the rally.
The IWNs were essentially unchanged for the week, although they had a really big dip yesterday, but got rid of the loss today.
None of these are strong bull market charts. They show the market is susceptible to random events for quick movement, but outside of those moves they are essentially evenly balanced between the bulls and bears.
Dollar Update
Here is a weekly chart from Stockcharts.
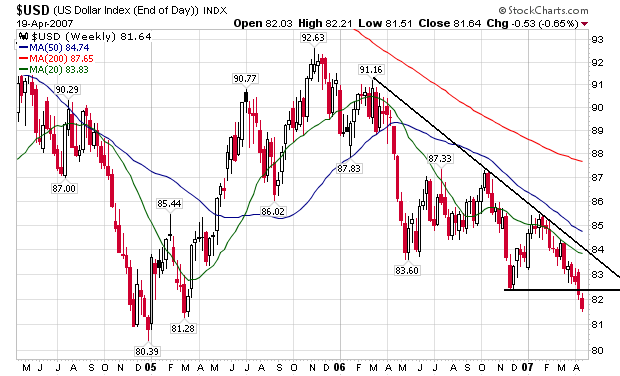
Notice the following.
1.) The dollar has broken through support and is now trying to find a new low.
2.) The downtrend started in early 2006 is still intact.
3.) The 20, 50 and 200 day SMAs are all heading lower.
In short, there is not one bullish element on this chart.
The underlying fundamentals are still bearish. The US economy is slowing while other economies are growing. While the trade deficit has decreased over the last few months, it is still at very high levels.
Notice the following.
1.) The dollar has broken through support and is now trying to find a new low.
2.) The downtrend started in early 2006 is still intact.
3.) The 20, 50 and 200 day SMAs are all heading lower.
In short, there is not one bullish element on this chart.
The underlying fundamentals are still bearish. The US economy is slowing while other economies are growing. While the trade deficit has decreased over the last few months, it is still at very high levels.
Oil Market Update
Here's a chart from Stockcharts.
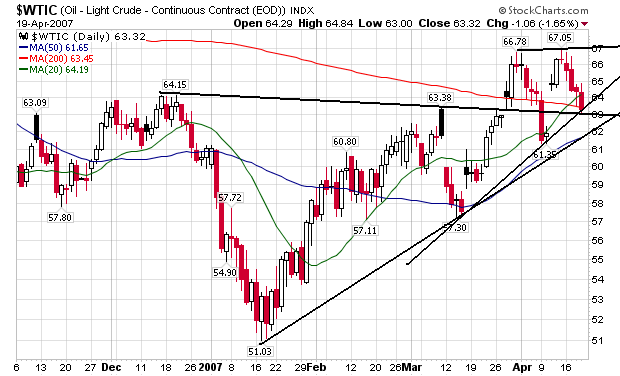
Notice the following points.
1.) The uptrend started in mid-January is still intact.
2.) The average is still above the support line drawn from mid-December to early March. This is the neckline of a head and shoulders pattern. Prices are just above this line right now, so we'll have to see how the average reacts to this line of support.
3.) The average has formed an ascending triangle pattern from mid-March to the present. That means we have lower bottoms which is usually a bullish indicator.
4.) The 20 and 50 day SMA are still trending up.
The fundamentals are still bullish. Demand is increasing and OPEC has successfully limited production. The US is starting the summer driving season and gas prices are already higher than at the same time last year.
Notice the following points.
1.) The uptrend started in mid-January is still intact.
2.) The average is still above the support line drawn from mid-December to early March. This is the neckline of a head and shoulders pattern. Prices are just above this line right now, so we'll have to see how the average reacts to this line of support.
3.) The average has formed an ascending triangle pattern from mid-March to the present. That means we have lower bottoms which is usually a bullish indicator.
4.) The 20 and 50 day SMA are still trending up.
The fundamentals are still bullish. Demand is increasing and OPEC has successfully limited production. The US is starting the summer driving season and gas prices are already higher than at the same time last year.
Thursday, April 19, 2007
Two Manufacturing Reports Show Slow Growth
I missed the NY Fed's manufacturing survey on Monday. Here's the main point of the report:
New orders were just above 0. Shipments dropped.
Here's some bad news for the Fed. Prices paid increased while prices received dropped slightly. The prices received index has dropped for three-straight months. This may indicate producers are having to cut prices to move product. In addition, inventories have increased three straight months, indicating future production may drop to prevent more of an inventory build-up.
The Philadelphia Fed reported similar conditions:
The Philly area also reported similar pricing problems as the New York Area -- increasing inputs and stagnant prices received:
These two reports indicate the decline in Capex spending may be hitting home with manufacturers.
In addition, manufacturers are just hanging on in positive/expansion territory.
The Empire State Manufacturing Survey indicates that conditions for New York manufacturers were flat again in April. The general business conditions index edged up 2 points, to 3.8, rebounding only marginally from March.
New orders were just above 0. Shipments dropped.
Here's some bad news for the Fed. Prices paid increased while prices received dropped slightly. The prices received index has dropped for three-straight months. This may indicate producers are having to cut prices to move product. In addition, inventories have increased three straight months, indicating future production may drop to prevent more of an inventory build-up.
The Philadelphia Fed reported similar conditions:
Activity in the region’s manufacturing sector was basically unchanged again this month, according to firms polled for the Business Outlook Survey. The index for general activity was near zero, and indicators for new orders, shipments, and employment were only slightly positive, suggesting little change from March. Regarding future activity, the region’s manufacturing executives were somewhat more optimistic this month than they were in March.
The Philly area also reported similar pricing problems as the New York Area -- increasing inputs and stagnant prices received:
Area manufacturers reported higher costs for inputs again this month. The prices paid index edged three points higher and has now increased for three consecutive months. Thirty-seven percent of the firms reported higher input prices, up seven points from March; 13 percent reported lower input prices in April.
Despite increased costs, fewer firms reported higher prices for their own goods this month: 17 percent reported higher prices, down nine points from March. The prices received index fell 11 points, to 5.2, its lowest reading since August 2005.
These two reports indicate the decline in Capex spending may be hitting home with manufacturers.
In addition, manufacturers are just hanging on in positive/expansion territory.
Flight to Quality Underway?
Below are three charts for the Utilities, Healthcare and Consumer Staples ETFs. The charts are for the price performance year to date. Notice how they have all done well this year.
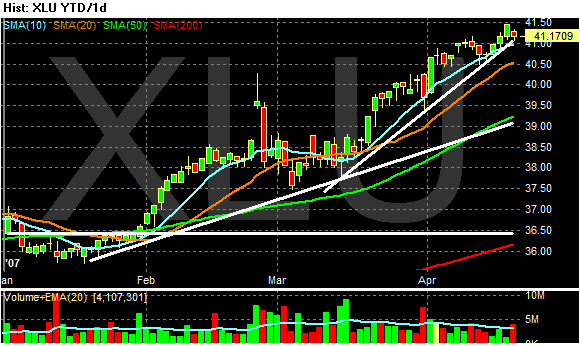
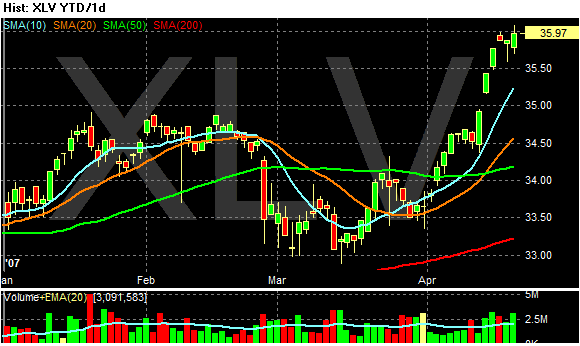
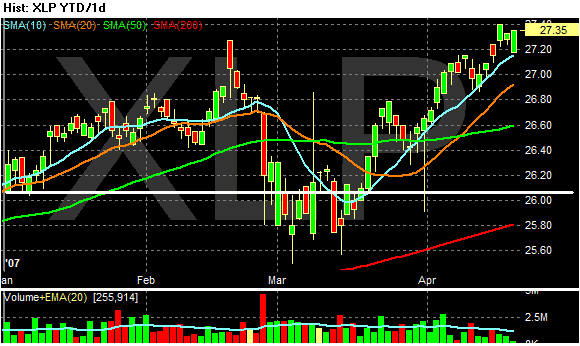
Is this the beginning of a flight to safety? It sure looks like it.
Is this the beginning of a flight to safety? It sure looks like it.
DR Horton's earnings drop 85%
From Reuter's:
There is nothing good in this report.
1.) Notice that land values are dropping.
2.) The company is "aggressively cutting prices." That will hurt profits and margins going forward.
3.) The company is using incentives aggressively. This hurts in several ways: it further hits profits and margins and it means home prices are in fact lower than stated.
4.) The company is now saying 2008 will be soft. That means housing problems will be with us for longer than we would like.
D.R. Horton Inc. (NYSE:DHI - News), the largest U.S. home builder, said on Thursday quarterly earnings fell 85 percent, in part due to charges related to the lower value of land.
.....
For the fiscal second quarter that ended March 31, D.R. Horton earned $51.7 million, or 16 cents per share, down from $352.8 million, or $1.11 per share, a year earlier.
The results included charges totaling $81.2 million, or 16 cents per share for land options forfeited and for the lower value of inventory of land and houses it owns.
"We believe that there will be continued softness in '08, and I would expect that we'll continue to adjust our inventories downward in the first two quarters of '08," Tomnitz said.
About 80 percent of the impairment charges were related to California projects, particularly in Sacramento. Horton, based in Fort Worth Texas, said it has begun to aggressively cut prices in California.
Excluding the charges, the earnings were 32 cents per share, short of the 36 cents that was the average of analysts' forecasts, according to Reuters Estimates.
A 7 percent reduction in the average selling price of a home and added incentives hurt gross margins before the charges. The margins fell to 17.7 percent, down 7.8 percentage points from the previous year and 0.9 percentage points from the prior quarter.
There is nothing good in this report.
1.) Notice that land values are dropping.
2.) The company is "aggressively cutting prices." That will hurt profits and margins going forward.
3.) The company is using incentives aggressively. This hurts in several ways: it further hits profits and margins and it means home prices are in fact lower than stated.
4.) The company is now saying 2008 will be soft. That means housing problems will be with us for longer than we would like.
A Deeper Look at Retail Sales
The following is from the comments section and frankly needs no further explanation.
Here’s the Shoppertrak monthly Year-over-Year data beginning Thanksgiving 2006:
Monthly data: sales/foot traffic
Holiday season: +5.0%/-1.7%
January: +4.9%/-3.9%
February: +4.3%/-4.9%
March: +2.7%/+2.9%
The weekly data has to be treated as noise, there is too much variability in volume in this weighted index.
The months’ sales and traffic tell a more interesting story. First, notice how each successive month is increasing less over last year’s numbers. In the case of March, adjusted for inflation, there was no growth YoY.
Second, notice how the YoY sales increases have been built on less traffic. This is a pretty startling statistic, in that it suggests that the “median” consumer has rolled over, but the “mean”, more wealthy consumer has enough wealth to casue the overall result to stay positive. March’s positive foot traffic may be due to Easter coming one week earlier this year. By the end of April, we should know if the trend is intact.
If the trend continues, we should have negative YoY retail sales no later than summer.
(BTW, I haven't found Shoppertrak's earlier 2006 data anywhere online. I'd be glad to take the series back further, if someone can supply a source).
Foreclosures Increasing
From IBD
I will continue to make this observation: we are in an economic expansion. Foreclosures should increase during a recession or just after a recession. If we have a recession we're in big trouble.
Home foreclosures rose 7% in March to 149,150, RealtyTrac said. The figure, which includes default notices, auction sale notices and bank repossessions, was up 47% vs. a year ago. It comes as the gov't urges lenders to try to rework troubled subprime loans. Also, mortgage applications fell 2.5% last week as rates rose again. Rates have retreated this week.
I will continue to make this observation: we are in an economic expansion. Foreclosures should increase during a recession or just after a recession. If we have a recession we're in big trouble.
US PC sales "sluggish"
From IBD:
IBD included this article so investors could get an idea of whether or not computer makers would be an attractive long of short. However, this information also gives us an idea of consumer sentiment going forward.
Retail sales are the only economic area holding the economy up. Because computers are a pricier item (with laptops still costing about $1000 per), consumer intent to purchase or not purchase these items gives us a clue for how confident consumers are going forward.
The drop in this number indicates consumers may not be that confident going forward. There could be a lot of non-income based reasons for this: Vista is unproven, it's too early to purchase for the fall semester etc... However, this number could also indicate consumers are either strapped financially or at least are pulling in their spending habits a bit.
The April index reading is almost 20% below the year-ago figure, and is 21% below the 12-month average.
Worse yet for the major PC makers — including Dell, (DELL) Hewlett-Packard, (HPQ) Apple (AAPL) and Gateway (GTW) — demand among some key customer groups has plummeted.
Planned PC purchases among parents sunk 32% in April from March. The purchase intent score for parents is at its lowest level since TechnoMetrica started measuring home PC purchase intent in April 2002.
Also hitting new lows for PC purchase intent were households with incomes over $75,000 and people with graduate or professional degrees. These groups are more likely to buy higher-end, feature-rich PCs, which carry higher prices and profits for PC makers, Kambanis says.
On a positive note, PC purchase intent among people 18 to 24 years old is at its highest level since the poll started five years ago.
IBD included this article so investors could get an idea of whether or not computer makers would be an attractive long of short. However, this information also gives us an idea of consumer sentiment going forward.
Retail sales are the only economic area holding the economy up. Because computers are a pricier item (with laptops still costing about $1000 per), consumer intent to purchase or not purchase these items gives us a clue for how confident consumers are going forward.
The drop in this number indicates consumers may not be that confident going forward. There could be a lot of non-income based reasons for this: Vista is unproven, it's too early to purchase for the fall semester etc... However, this number could also indicate consumers are either strapped financially or at least are pulling in their spending habits a bit.
Wednesday, April 18, 2007
Gas Prices Are Still Rising
From This Week in Petroleum
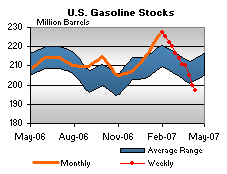
Inventories are still down
And prices are still increasing:
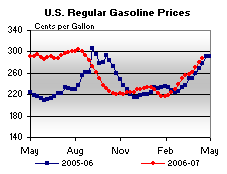
For the eleventh consecutive week, gasoline prices increased, climbing 7.4 cents to 287.6 cents per gallon for the week of April 16, 2007. Prices are now 9.3 cents per gallon higher than at this time last year. All regions reported higher prices. East Coast prices were up 8.4 cents to 283.9 cents per gallon. The Midwest saw prices rise 6.3 cents to 280.7 cents per gallon. The largest regional increase was in the Gulf Coast, with prices up 8.8 cents to 276.3 cents per gallon. Rocky Mountain prices increased 8.2 cents to 280.1 cents per gallon. West Coast prices were up 5.7 cents to 319.5 cents per gallon, with the average price for regular grade in California up 5.3 cents to 330.5 cents per gallon, 40.9 cents per gallon above last year's price.
Inventories are still down
And prices are still increasing:
What Percentage Subprime?
This chart is from the WSJ's Marketbeat blog. Notice the large percentage of loans written last year to either subprime borrowers or second homebuyers.
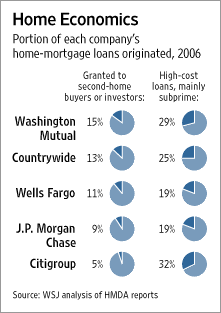
I'm not saying this is good or bad. What I am saying is it seems like a fair amount of mortgage loans were made to people who either had questionable credit or already had a home.
I'm not saying this is good or bad. What I am saying is it seems like a fair amount of mortgage loans were made to people who either had questionable credit or already had a home.
Debt Growth, Equity Prices and Consumer Spending
The following is from an email I received that comes from an options group I belong to. The article is written by Dr. Marc Faber.
Let's look at two strands of thought Dr. Faber puts together.
The growth in the mortgage market was about equal to nominal GDP growth between 1980 and 2000. But, in the 2000 to 2006 period, a massive breakout from the trend occurred and, combined with a decline in the saving rate, drove consumption and GDP growth.
Consider the following debt statistics which are from the Federal Reserve's Flow of Funds report and information from the Bureau of Economic Analysis:
Household Debt/GDP
2000. $6.999/$9.817 = 71%
2005. $11.803/$12.455= 94%
2006. $12.815/$13.246 = 96%
Household Debt/Disposable Income
2000. $6.999/$7.194 = 97%
2005. $11.803/$9.036= 130%
2006. $12.815/$9.522 = 134%
Notice the mammoth jump over the last five years. This indicates that record low interest rates were a prime driver of consumption.
However, although debt acquisition has slowed, consumer spending has not shown a similar decline (although it is weakening after adjusting for inflation). I believe that Faber makes a correct observation about what has driven consumption for the last 6-9 months:
Continuous consumption growth was therefore driven less by household debt growth in the fourth quarter of last year and the first quarter of this year, than by the continuation of an increase in household wealth and the selling of US equities by the household sector.
According to the Federal Reserves Flow of Funds Report total household positions in equities increased from $14.829 trillion in 2005 to $16.275 in 2006. In other words, Faber is arguing (and I believe correctly) that the equity markets are responsible for the latest cash infusion into consumers pocketbooks and therefore their spending habits.
If this thesis proves correct, then a sustained decline in equity prices will be the driver of declining retail sales and personal consumption.
I would add that as long as job and income growth remain at current levels, they may provide a mitigating factor to the above mentioned downturn.
Food for thought.
First, it is important to understand that mortgage debt has begun to grow at a slower pace largely because home prices are no longer appreciating. The growth in the mortgage market was about equal to nominal GDP growth between 1980 and 2000. But, in the 2000 to 2006 period, a massive breakout from the trend occurred and, combined with a decline in the saving rate, drove consumption and GDP growth. But, as home prices began to decline in 2006, and as problems in the subprime lending market became evident, lending standards were tightened to their highest level in 15 years. Declining home prices and tighter lending standards brought about a slowdown not only in mortgage debt growth but also in overall debt growth. Mortgage debt, which grew at an annual rate of 10.2% in the second quarter of 2006, declined to an annual growth rate of 8.6% in the third quarter and to 6.4% in the fourth quarter. It is likely that mortgage debt growth slowed down further in the first quarter of 2007, and will decline even more in the second quarter given the problems in the sub-prime lending industry and the tight lending standards.
In the meantime, household debt growth in the United States has declined from a peak of 11.9% in the third quarter of 2005 to 6.6% annual rate in the fourth quarter of 2006. According to David Rosenberg, the fourth-quarter 2006 annual credit growth was the slowest since the third quarter of 1998 and the sixth consecutive quarterly deceleration, “which hasn’t happened since 1956” (emphasis added). Now, ceteris paribus, this significant slowdown in mortgage and household debt accumulation would have already brought about a significant slowdown, or even a decline, in US consumption. However, because of the stock market rally in the fourth quarter of 2006, equity wealth increased by 4.2%, or an annual rate of 18%.
......
Now, this deterioration in household debt growth hasn’t yet led to a consumer spending decline; but, very clearly, retail sales are now growing more slowly. Continuous consumption growth was therefore driven less by household debt growth in the fourth quarter of last year and the first quarter of this year, than by the continuation of an increase in household wealth and the selling of US equities by the household sector. But herein lies the problem. If declining home prices are now joined by equity prices that are either declining or no longer rising, it will only be a matter of time before consumer confidence declines and the consumer either slows down their spending further or stops spending altogether.
Let's look at two strands of thought Dr. Faber puts together.
The growth in the mortgage market was about equal to nominal GDP growth between 1980 and 2000. But, in the 2000 to 2006 period, a massive breakout from the trend occurred and, combined with a decline in the saving rate, drove consumption and GDP growth.
Consider the following debt statistics which are from the Federal Reserve's Flow of Funds report and information from the Bureau of Economic Analysis:
Household Debt/GDP
2000. $6.999/$9.817 = 71%
2005. $11.803/$12.455= 94%
2006. $12.815/$13.246 = 96%
Household Debt/Disposable Income
2000. $6.999/$7.194 = 97%
2005. $11.803/$9.036= 130%
2006. $12.815/$9.522 = 134%
Notice the mammoth jump over the last five years. This indicates that record low interest rates were a prime driver of consumption.
However, although debt acquisition has slowed, consumer spending has not shown a similar decline (although it is weakening after adjusting for inflation). I believe that Faber makes a correct observation about what has driven consumption for the last 6-9 months:
Continuous consumption growth was therefore driven less by household debt growth in the fourth quarter of last year and the first quarter of this year, than by the continuation of an increase in household wealth and the selling of US equities by the household sector.
According to the Federal Reserves Flow of Funds Report total household positions in equities increased from $14.829 trillion in 2005 to $16.275 in 2006. In other words, Faber is arguing (and I believe correctly) that the equity markets are responsible for the latest cash infusion into consumers pocketbooks and therefore their spending habits.
If this thesis proves correct, then a sustained decline in equity prices will be the driver of declining retail sales and personal consumption.
I would add that as long as job and income growth remain at current levels, they may provide a mitigating factor to the above mentioned downturn.
Food for thought.
A Note on Core Inflation
OK -- raise your hand it you DO NOT
- Buy food
- Eat at a restaurant
- Cook food
- Drive a car
- Use electric power
- Consume energy in any way, shape or form.
For those of you who raised your hands, put them down because you're lying.
There was a lot of talk about the tame CPI number yesterday. That's all well and good, but the last time I checked everybody eats food and uses energy in one form or another. That means the total CPI number is the most relevant to all consumers.
End rant.
- Buy food
- Eat at a restaurant
- Cook food
- Drive a car
- Use electric power
- Consume energy in any way, shape or form.
For those of you who raised your hands, put them down because you're lying.
There was a lot of talk about the tame CPI number yesterday. That's all well and good, but the last time I checked everybody eats food and uses energy in one form or another. That means the total CPI number is the most relevant to all consumers.
End rant.
Sub Prime Problems Start to Hit Bank Earnings
From the WSJ:
This is the kind of news that leads to the following development:
1.) Banks tighten their lending standards. There is already tightening going on in the subprime market. Don't be surprised to see this trend extend to other, better quality loans.
2.) Expect banks to begin slipping loan loss provision increases into statements. They will try to minimize the effect of these statements, so you have to keep an eye out for the odd announcement here and there.
3.) Expect to hear more stories about people with exotic mortgages having trouble refinancing.
4.) Foreclosures are already increasing. This is the end result of all this news. As banks tighten their credit standards, people with problems loans will be less able to refinance their loans. This will more than likely lead to an increase in foreclosures.
Of the six banks that reported earnings yesterday, four -- SunTrust, U.S. Bancorp, Comerica Inc. and M&T Bank Corp. -- saw net income fall from the year-ago quarter. KeyCorp, of Cleveland, posted a 31% gain in quarterly profit, helped by the sale of its McDonald Investments unit.
...
Wells Fargo cited higher losses on home-equity loans in the Midwest and in central California. Howard Atkins, Wells's chief financial officer, said deterioration in certain markets was caused by rising interest rates on some mortgages combined with falling home prices, creating very high loan-to-value ratios that made it difficult for borrowers to refinance out of high-cost loans.
...
Minneapolis-based U.S. Bancorp said net income fell 2% from a year ago, citing higher credit costs and operating costs of acquired businesses and lower net-interest income, which offset growth in fees.
SunTrust saw net income fall 2%. While revenue grew 1% and outpaced growth in expenses, it wasn't enough to overcome an increase in the provision for loan losses. SunTrust said nonperforming loans rose to 0.57% of total loans from 0.25% a year ago, largely due to slipping credit quality on low-documentation, or "Alternative A," loans.
Detroit-based Comerica said net income fell 2%, despite a tight rein on expenses, due to a higher loan-loss provision.
M&T Bank, based in Buffalo, said profit fell 13% due to previously disclosed declines in mortgage revenue. The bank said buyers of Alternative A loans are getting scarce, forcing M&T to keep more loans on its books.
This is the kind of news that leads to the following development:
1.) Banks tighten their lending standards. There is already tightening going on in the subprime market. Don't be surprised to see this trend extend to other, better quality loans.
2.) Expect banks to begin slipping loan loss provision increases into statements. They will try to minimize the effect of these statements, so you have to keep an eye out for the odd announcement here and there.
3.) Expect to hear more stories about people with exotic mortgages having trouble refinancing.
4.) Foreclosures are already increasing. This is the end result of all this news. As banks tighten their credit standards, people with problems loans will be less able to refinance their loans. This will more than likely lead to an increase in foreclosures.
Subscribe to:
Posts (Atom)