- by New Deal democrat
COVID-19 is still a pandemic, and is gradually going to transition to endemic. A year ago I thought that between nearly universal vaccinations and an increasing percentage of the population already infected, the virus would wane into a background nuisance by now.
No more. I am now thoroughly convinced that there will be an unending series of variants that will create continuing waves of new infections and, increasingly importantly, RE-infections. The percent of the population fully vaccinated (not even counting boosters) has come to a screeching halt at 66%. And even in jurisdications with high percentages of vaccinated people, like Vermont, Puerto Rico, and Rhode Island, new infections have continued to run rampant (although the death numbers have steeply declined with vaccinations).
Rhode Island is particularly instructive, because 35% of the population had already had *confirmed* cases of COVID two months ago (which means that probably double that percentage, or 70%, had *actually* been infected), and 83% of the population was fully vaccinated. In other words, probably 95% or more of the population had either been vaccinated or previously infected. And yet, that was no protection at all against the BA.2 and BA.2.12.1 wave that began over a month ago.
Nevertheless, let’s look at the numbers.
BA.2.12.1 has gradually been becoming the dominant variant, per the CDC’s variant “nowcast” through last Saturday:
In about another month, BA.2.12.1 should be 90% or more of all infections.
BA.2.12.1 is already dominant in NY, NJ, and PR, constituting 66% of all cases:
BA.2.12.1 is also nearly half of all cases along the rest of the East Coast and, oddly, the northern Great Plains, but a much smaller percentage elsewhere, especially along the West Coast:
In the bellwether jurisdictions of NY, NJ, and PR, cases are still rising by 20%-30% a week:
To the extent there is good news, is that in most areas of Upstate New York, cases are flat or already declining. This is particularly true in the Central NY region, where BA.2.12.1 was first identified:
Cases tripled between March and April, but are down 30% since then. Even at peak, cases were only about 20% of their previous Omicron peak.
Nationwide cases have tripled since their bottom 5 weeks ago, but deaths have only started to rise in the past week:
Deaths will probably be near 1000/day in about a month.
The long term picture of deaths vs. infections shows that, with the exception of Delta, each successive wave has been *relatively* less lethal than the wave before it (thick line is deaths; thin line ins infections):
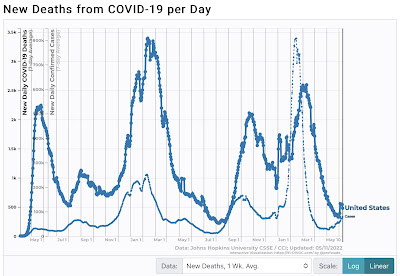
This probably shows us the longer-term evolution of the virus. It will gradually move from pandemic to endemic. This is not necessarily because the virus will become intrinsically less deadly. It is more likely going to be because over time (several years) an increasing percent of the population will finally get vaccinated, and repeated re-infections will give the population more inherent resistance. Meanwhile the virus will continue to evolve to become ever more transmissible, as those mutations most capable of successfully infecting the vaccinated and the previously infected population will reproduce more. Meanwhile, to be blunt, that portion of the population most susceptible to lethal outcomes, like the institutionalized elderly, will already have been killed by the virus, and they can only die once.