Thursday, April 14, 2016

Bonddad Thursday Linkfest

We'll be doing our regular monthly economic review on Thursday, April 28th at 3PM CST.  You can sign up at this link.


Bank of Canada Keeps Rates Unchanged (BOC)


Governing Council judged that the combination of slower global and US growth, a new round of cuts to investment in Canada’s energy sector, and a stronger Canadian dollar would have meant a lower projected growth profile for the Canadian economy than we had in January. I know this sounds contrary to what you have heard lately, because a range of monthly economic indicators have started the year strongly. Some of this strength represents a catch-up after temporary weakness in the fourth quarter, and some of it reflects temporary factors that will unwind in the second quarter. We think it is best to look through that variability, and note that the economy appears to be achieving average growth of close to 2 per cent in the first half of the year, which is encouraging.

.....

Specifically, the collapse in investment in the commodity sector will mean a slowdown in the economy’s potential growth rate. In the near term, we’ve lowered potential output growth from 1.8 per cent to 1.5 per cent. You can find details in a staff analytical note we published today. Later this year, the natural sequence of higher non-resource exports and a tightening of capacity constraints should lead to higher investment and employment in the non-resource economy, and therefore growing capacity. Looking beyond the projection horizon, growth in potential output overall should pick up again. This newly-added capacity may give the economy some additional room for non-inflationary growth beyond what we are assuming today.


Weekly Chart of Canadian ETF


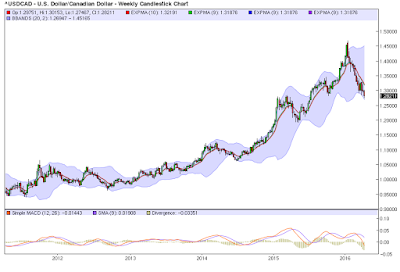
5-Year Chart of USD/CAD


M/M Change


Y/Y Percentage Change


The U.S. Census Bureau announced today that advance estimates of U.S. retail and food services sales for March, adjusted for seasonal variation and holiday and trading-day differences, but not for price changes, were $446.9 billion, a decrease of 0.3 percent (±0.5%)* from the previous month, and 1.7 percent (±0.7%) above March 2015. Total sales for the January 2016 through March 2016 period were up 2.8 percent (±0.5%) from the same period a year ago. The January 2016 to February 2016 percent change was revised from down 0.1 percent (±0.5%)* to virtually unchanged (±0.2%)*


The bottom line: the jury’s out on what today’s numbers mean, if anything. But until (or if) we see convincing evidence to the contrary, it appears that the retail sector’s forward momentum has slowed. The big question is how the broad trend looks once this week’s numbers clear. The threat of a new recession remained low for the US as of the Apr. 10 edition of the US Business Cycle Risk Report. Will the upbeat tone survive with this weekend’s update of fresh data–including today’s retail figures? Probably, although it’s only Wednesday. Let’s see what the wind blows in for tomorrow’s weekly numbers on jobless claims and Friday’s monthly update on industrial production.

“We’re having a little bit of a soft patch here for the consumer, with no obvious rationale,” Michael Feroli, chief US economist at JPMorgan Chase, tells Bloomberg. “It’s definitely a softer start to the year. Provided job gains remain as strong as they’ve been, we expect consumer spending should be OK.”


The three-tiered deposit system with the BOJ


Commercial banking, the division run by Doug Petno, posted a 17 percent pofit decline to $496 million as loan-loss reserves, fueled by the industry’s exposure to energy companies, surged to $304 million from $61 million a year earlier.


Basic JPM Data from Finviz.com


JPM Weekly Chart


Complexity is the enemy of stability. Financial conglomerates have become too diverse and sprawling for their chief executives or boards to understand what they do. The same complexity creates endemic conflicts of interest and is associated with cross subsidy between activities. There are fundamental differences in the cultures required to trade derivatives, to give private financial advice to big corporations, to manage assets on behalf of savers and to provide an efficient retail banking service.


Why Aren't Low Oil Prices Leading to Increased Consumer Spending? (IMF)


Though a decline in oil prices driven by higher oil supply should support global demand given a higher propensity to spend in oil importers relative to oil exporters, in current circumstances several factors have dampened the positive impact of lower oil prices.  First and foremost, financial strains in many oil exporters reduce their ability to smooth the shock, entailing a sizable reduction in their domestic demand. The oil price decline has had a notable impact on investment in oil and gas extraction, also subtracting from global aggregate demand.  Finally, the pickup in consumption in oil importers has so far been somewhat weaker than evidence from past episodes of oil price declines would have suggested, possibly reflecting continued deleveraging in some of these economies. Limited pass-through of price declines to consumers may also have been a factor in several emerging market and developing economies.


Analysts Are Invariably Bullish When They Start Estimating Earings


Wednesday, April 13, 2016

"Less bad" producer commodity deflation - a good sign


 - by New Deal democrat

As an initial matter, while this morning's retail sales number wasn't good, after the poor report on March auto sales, I can't imagine why anybody was surprised.  Since inflation adjustments in retail sales are important, I'll withhold further comment until the CPI is reported tomorrow.

Like the big decline in corporate bond yields that I wrote about Monday, this morning's producer price report is in line with the idea that the shallow industrial recession is ending.  We have over 100 years of data on producer commodity prices, and what they show is that deflationary (or even severe disinflationary) recessions always end at very least when the YoY% decline is less than half of its worst level (1927, 1929-32), and most often right when the change in YoY commodity prices are at their worst. 

Here's 1920 -1962:


Here's 1982 - present:


Here is a close-up on the last two years:


I would like to see YoY commodity deflation of less than -4% before I would be confident that the industrial recession is over.  But we certainly appear to have passed the deepest point of YoY commodity deflation.

Bonddad Wednesday Linkfest

We'll be doing our regular monthly economic review on Thursday, April 28th at 3PM CST.  You can sign up at this link.


IMF Issues Global Growth Warning (IMF)


Global growth continues, but at a sluggish pace that leaves the world economy more exposed to risks, says the IMF’s latest World Economic Outlook (WEO).

The WEO forecasts global growth at 3.2 percent in 2016 and 3.5 percent in 2017, a downward revision of 0.2 percent and 0.1 percent, respectively, compared with the January 2016 Update (see table).

In a recent speech, IMF Managing Director Christine Lagarde warned that the recovery remains too slow, too fragile, with the risk that persistent low growth can have damaging effects on the social and political fabric of many countries.

“Lower growth means less room for error,” said Maurice Obstfeld, IMF Economic Counsellor and Director of Research. “Persistent slow growth has scarring effects that themselves reduce potential output and with it, demand and investment,” he added.

The current diminished outlook calls for an immediate, proactive response, Obstfeld noted. To support global growth, he emphasized, there is a need for a more potent policy mix—a three-pronged policy approach based on structural, fiscal, and monetary policies.

"If national policymakers were to clearly recognize the risks they jointly face and act together to prepare for them, the positive effects on global confidence could be substantial,” Obstfeld added.


IMFs Growth Projections


UK PPI -.9% (ONS)

The price of goods bought and sold by UK manufacturers, as estimated by the producer price index, continued to fall in the year to March 2016.

Factory gate prices (output prices) for goods produced by UK manufacturers fell 0.9% in the year to March 2016, compared with a fall of 1.1% in the year to February 2016.

Core factory gate prices, which exclude the more volatile food, beverage, tobacco and petroleum products, rose 0.2% in the year to March 2016, compared with a rise of 0.1% in the year to February 2016.


Y/Y Change in UK PPI


UK CPI + .5% (ONS)


The Consumer Prices Index (CPI) rose by 0.5% in the year to March 2016, compared with a 0.3% rise in the year to February.

The rate has increased gradually since October 2015 although is still relatively low in the historical context.


Y/Y Change in UK CPI


A Look At US-Mexico Trade (Dallas Fed)


Since the implementation of the North American Free Trade Agreement (NAFTA), trade between the U.S. and Mexico has seen tremendous growth, increasing from approximately $160 billion in 1994 to currently over $530 billion. For the U.S., Mexico has become its third most important trade partner (after Canada and China), and for Mexico, the U.S. is the top trade partner.  Due to NAFTA’s reduction in tariffs and elimination of trade barriers, U.S.–Mexico intraindustry trade has also expanded notably. Currently, approximately 40 percent of content inU.S. imports from Mexico originated in the U.S., surpassing the U.S. content in imports from Canada (25 percent) and China (4 percent).1


 The increased bilateral trade and production sharing between the U.S. and Mexico resulted in stronger economic integration among the two  countries and in a synchronization of the U.S. and Mexico business cycles, as depicted in Chart 1. It is clearly visible that in the post-NAFTA period, 
bothU.S. and Mexico industrial production became quite synchronized.


US-Mexico Imports and Exports


Weekly Chart of the Mexico ETF


Health Care Sector Hit By Earnings Weakness (WSJ)


Investors were never expecting a particularly strong earnings season, but the weaknesses are showing up in unlikely places.

One of them is the health-care sector.


So far, 94 companies in the S&P 500 Index have issued earnings-per-share guidance below consensus analyst estimates, the second highest level on records going back a decade, according to FactSet. Seventeen of those companies were in health care, a record for the sector.


Daily Chart of the Health Care ETF


Last December, the FOMC decided to raise rates for the first time in seven years, increasing the target federal funds rate to ¼ to ½ percent. Now that the first interest rate increase is out of the way, the question on everyone’s mind is how rapidly interest rates will rise in the current year. Many observers have noted that central banks in some other major countries have actually moved toward easier monetary policy in recent months. In January, for example, the Bank of Japan announced that it would begin charging an interest rate of negative 0.1 percent on reserves held at the central bank. In March, the European Central Bank, which has charged negative interest rates on such reserves for nearly two years, announced further cuts to several key interest rates and expanded its asset purchase program.

These policy decisions were a response to slowing inflation and economic growth in their respective regions. But the situation in the United States is different. As I will discuss in more detail, our labor markets are strong and growing stronger, and the household sector is healthy. This is fueling steady growth in household spending, which is a substantial portion of GDP. Certainly, many American households still face significant economic challenges. But overall, the prospects for continued growth in employment and consumer spending look good. As I will discuss later, U.S. economic leadership within the global economy makes divergence between the monetary policies of the United States and other major economies that much more likely.

Tuesday, April 12, 2016

Bonddad Tuesday Linkfest

We'll be doing our regular monthly economic review on Thursday, April 28th at 3PM CST.  You can sign up at this link.


Steel Price Recovery?

A recent recovery in Chinese steel prices has been read by some local mills as a sign of budding recovery fed by China’s seemingly stabilising economy.

However, some analysts believe that the fall in overall Chinese demand will ultimately haul back buoyant prices as prospects of significant new investment in China’s main steel-intensive industries remains poor.

Whether Chinese steelmakers can stage an orderly recovery is critical for a global market that was buffeted last year by 20 per cent year-on-year growth in cheap Chinese exports.


Brazil's Impeachment Heating Up

A Brazilian congressional committee has voted in favour of impeaching President Dilma Rousseff for manipulating the budget, bringing her ousting a step closer as currency markets rallied.

The special committee on Monday evening voted by 38 to 27 in favour of Ms Rousseff’s removal in a decision that sets the stage for a crucial vote in a full session of the lower house of congress as early as Sunday. Lawmakers supporting the leftist president’s impeachment shouted “out with Dilma”, while those against cried: “There will be no coup.”

“There no longer exists the political climate for this government, there no longer exists the political base to sustain it, no one believes any more in this government,” said Jovair Arantes, the leader of the committee, ahead of the vote.


Foreign Investors Are Pulling Out of Japanese Stocks


Starting in the first days of 2016, foreign traders have been pulling out of Tokyo’s stock market for 13 straight weeks, the longest stretch since 1998. Overseas investors dumped $46 billion of shares as economic reports deteriorated, stimulus from the Bank of Japan backfired and the yen’s surge pressured exporters. The benchmark Topix index is down 17 percent in 2016, the world’s steepest declines behind Italy.

.....

Overseas investors, which account for about 70 percent of the value traded in Tokyo shares, bought a net 18.5 trillion yen between 2012 and 2015. Global fund managers, which were negative on Japanese shares for almost all of the five years before Abe came to power, have been overweight every month since, according to a Bank of America Corp. Merrill Lynch survey.


The company's debt problems are no secret. Out of 70 large U.S. telecom and tech hardware companies, only seven of them top Sprint's net debt of 4.3 times its adjusted earnings before interest, taxes, depreciation and amortization in the prior 12 months, according to an analysis of Bloomberg data.


The bottom line is that buybacks tend to be expensive, poorly timed, pro-cyclical, subject to cancellation without notice, not guaranteed and often serve to offset compensation for company insiders. Dividends represent a real return of cash to shareholders, are carefully considered, counter-cyclical and durable.

A company can't destroy value by returning cash in the form of a dividend. But it can surely waste money on a buyback. In order for a share buyback to return 100 cents on the dollar, a lot of things have to go just right.


Despite forecasts of an eventual improvement in the oil market, U.S. oil and gas firms have continued to face difficult decisions about how to deal with the immediate reality of low energy prices. A number of upstream firms have announced substantial cuts to their capital spending in 2016 (Chart 5). Many have also been forced to lay off workers. Nationwide, oil and gas companies shed more than 20,000 jobs in first quarter 2016. Given current oil and gas prices, it is likely that many companies will continue to face difficulties in the quarter to come and beyond.


Monday, April 11, 2016

Why the -0.75% decline in corporate bond yields is a semi-big deal


 - by New Deal democrat

I have a new post discussing the importance of this year's big decline in corporate bond yields up at XE.com .

Bonddad Monday Linkfest

We'll be doing our regular Monthly economic review on Thursday, April 28th at 3PM CST.  You can sign up at this link.

Great overall summation of the current economic and market environment (SA)
Paul Ryans Parallel campaign (NYT)
GOP really doesn't want Trump (NYT)
Major donors aren't donating (Politico)
Why no boost from oil prices (James Hamilton)
Bond defaults at highest level since the Great Recession (FT)
Will this be the year for TIPS (FT)


Not nearly enough attention has been paid to the toll these low rates — and now negative rates — are taking on the ability of investors to save and plan for the future. People need to invest more today to achieve their desired annual retirement income in the future. For example, a 35-year-old looking to generate $48,000 per year in retirement income beginning at age 65 would need to invest $178,000 today in a 5% interest rate environment. In a 2% interest rate environment, however, that individual would need to invest $563,000 (or 3.2 times as much) to achieve the same outcome in retirement.

This reality has profound implications for economic growth: consumers saving for retirement need to reduce spending if they are going to reach their retirement income goals and retirees with lower incomes will need to cut consumption as well. A monetary policy intended to spark growth, then, in fact, risks reducing consumer spending.


Saturday, April 9, 2016

Weekly Indicators for April 4 - 8 at XE.com


 - by New Deal democrat

My Weekly Indicator post is up at XE.com .

Rail traffic remains awful, but the bigger news is the major decline in corporate bond yields.

Friday, April 8, 2016

Wholesale inventories and sales: bad news for Q1, good news for the year


  - by New Deal democrat
While this morning's report on wholesale sales and inventories for February isn't good news for Q1 GDP, in the longer term it means that the inventory correction is working itself out. 
Let's start with the updated inventory to sales ratio for wholesalers, which declined .01 from 1.37 to 1.36:

Wholesale inventories dropped 0.5 percent in February, the Commerce Department said on Friday, the sharpest decline since May 2013. Analysts polled by Reuters expected a 0.1 percent decline.The government also revised its reading for January to show a 0.2 percent decline in inventories rather than a 0.2 percent rise. 
Wholesale sales, meanwhile, slid 0.2%.
January's -1.3% decline in sales was also revised down -.2% to -1.5%. 

More often than not, a big increase in the inventory to sales ratio is accompanied by a recession. But a minority of the time, it is just an inventory correction - most importantly, in 1998 when the US$ soared, just as it did in 2014-15. In either case, sales lead inventory, as shown in this graph through December (FRED won't update until next week):

In the inventory correction scenario,
- pressure of the US$ eases - which it already has this year.
- commodity prices firm - which appears to have happened beginning last November.
- new orders increase - which we have from the ISM new orders index in the first three months of this year.
- inventory continues to decline - this is now established for wholesalers for the last 5 months.
- sales increase - not yet (as of February)!
So while a negative GDP print for Q1 becomes more likely (as forecast by the Leading Indicators last summer), the progression of numbers gives me increased confidence that the shallow industrial recession that was caused in large part by the surge in the US$, is coming to an end.
Next week watch for producer prices of commodities YoY.  Here's what they look like now:


If they get "less bad," that is more evidence that this has been an inventory correction that won't grow into an actual recession.

From Bonddad:

A few points:

Here's a 5-year chart of the US dollar:


The overall level has moved lower since the end of last year.  But the real test will be a move below the ~93.75 level.  With the Fed on the sideline for now, that's a distinct possibility.

I'm not completely sold on the rebounding commodities story.


The weekly oil chart is still very bearish.  While prices broke through upside resistance a few weeks ago, they have since retreated below important technical levels.  I'd need to see a move above the 50-week EMA to be sold on the rebound or bottoming story.

Industrial metals have a similar weekly chart to oil:


Like oil, we've seen a nice bounce.  But the fundamental picture is still bearish.  China is slowing, lowering their demand.  The global build-out in raw material extraction over the last 5+ years is forcing basic materials companies to continue producing to at least cover fixed costs.  This keeps supply flowing, adding further downward pressure on prices.  So we're seeing an increase in product and lower demand occur when there is weak global demand.

I'm more comfortable with an assessment that a bottom may by in.


Bonddad Friday Linkfest

We'll be doing our regular Monthly economic review on Thursday, April 28th at 3PM CST.  You can sign up at this link.


EM Bonds Have Upside Room to Run


Thursday, April 7, 2016

The Bond Market Is GDP Bearish

In today's linkfest, I linked to a post from the Capital Spectator that argues (I believe convincingly) the treasury market is predicting a weaker equity market.

I wanted to briefly expand on the author's point.  

Treasuries rally when traders see weaker economic growth and, in correlation, lower inflation.  The reason is simple: slower economic growth leads to lower revenue growth, leading to weaker earnings. And weak earnings are a drag on equity indexes.  In addition, in a weaker growth environment, traders like to increase the treasury component of their portfolios for their stable and predictable return.  Finally, weak growth usually leads to lower inflationary pressures.  

The converse is also true: when traders see stronger fundamental growth, they sell treasuries, opting for the potentially higher returns of the equity market.  In addition, stronger growth usually leads to increasing inflation.

That being said, here is the weekly chart for the IEFs -- the 7-10 year treasury market ETF:


The market has been in an uptrend since the end of 2013.  Let's now turn to the TLTs:


There are three primary patterns.

1.) A rally from the end of 2013 to the beginning of 2015
2.) A brief sell-off followed by a triangle consolidation in 2015
3.) A rally through upside resistance of the consolidation triangle at the beginning of 2016.

Notice there is no sell-off in sight.

Consider the above developments in conjunction with the latest release from the Atlanta GDP Now model:

The GDPNow model forecast for real GDP growth (seasonally adjusted annual rate) in the first quarter of 2016 is 0.4 percent on April 5, down from 0.7 percent on April 1. After yesterday morning's light vehicle sales release from the U.S. Bureau of Economic Analysis and the manufacturing report from the U.S. Bureau of the Census, the forecast for real GDP growth declined from 0.7 percent to 0.4 percent due to declines in the forecasts for real consumer spending growth and real equipment investment growth. The forecast for real GDP growth remained at 0.4 percent after this morning's international trade report from the U.S. Census Bureau, as a slight decline in the forecast for real net exports was offset by a slight increase in the forecast of real equipment investment growth.

The model has been decreasing since the beginning of February.


Overall, 1QGDP does not look good right now.


Bonddad Thursday Linkfest


We'll be doing our regular Monthly economic review on Thursday, April 28th at 3PM CST.  You can sign up at this link.


Wednesday, April 6, 2016

Jazz Shaw Now Relies on Discredited Research For Bogus Minimum Wage Argument

I've blogged about Jazz Shaw several times before (see here, here and here).  He is economically incompetent.  Of course, that doesn't stop him from writing about economics.

He has relied on the works of Mark Perry of the AEI to argue an increase in the minimum wage causes job losses.  However, it turns out some of Mark Perry's assertions were based on, shall we say, highly questionable data methods.  Reid Wilson and H. Luke Shaefer at the University of Michigan document the faults at this link.  This type of issue brings into question all of Mr. Perry's assertions and, by way of extension, Mr. Shaws arguments.

If Mr. Shaw were an honorable or ethical man, he would print a retraction of his arguments.  

I'm not holding my breath.

JOLTS, Labor Market Conditions Index give different clues to job growth


 - by New Deal democrat

After a blizzard of data last Friday, this week is pretty desolate.  But we do have two follow-up reports on the labor market: the Labor Market Conditions Index, and the JOLTS report.

Let's start with the LMCI.  As I have previously noted, the LMCI shows promise as a long leading indicator, as 40 years worth of data shows it turning negative usually a year or more before the onset of a recession:


As you can see, it also does a good job forecasting the YoY direction of job growth.

This month's report was the third in a row that was negative.  This is another small addition to the evidence that 2017 might be a poor year.  It also suggests that monthly job gains, currently averaging just under 225,000, will continue to decelerate.


Now let's turn to the JOLTS report.  While it is an extremely useful dissection of the labor market,  it has only existed for 15 years, and thus includes only one full expansion.  Comparing this month's report with those of a few months ago shows why trends in the report must be taken with many grains of salt.

For the last year I was unimpressed with the report.  True, job openings (blue in the graph below) were soaring to new heights, but actual hires (red) stalled -- the same pattern as in 2005-06. late in the last cycle.  Two months ago openings decreased significantly - something which happened just before the 2007 recession started.  Here is the complete series, including yesterday's report for February:


The pattern from the last expansion was: first, hires peak.  Then, openings peak.

Here is a YoY look at the same data:


Openings had been rising faster than hires, which are have been barely positive.  Until two months ago, when hires soared to a new all-time high, as shown in the first graph above at far right.  Since then, the upward trend in hires has remained.

Some more good news was contained in the quits rate, which also continued in an uptrend, if not quite at their record of two months ago (red in the graph below):


This means that workers were confident enough in their prospects to voluntarily leave their jo bs.  Note that layoffs (blue) remained low.  Needless to say, the increase in voluntary quits is a significant positive.

Further, last month  Dean Baker made a point that there is "pent up damend" for quits, and therefore they should continue to all time record highs. Here's a link to a graph of the U6 underemployment rate (inverted) vs. Quits:


For every level of underemployment over the last 3 years or so, there have been more Quits than occurred during the last cycle -- supporting the  hypothesis of "pent up demand."

So, while the LMCI continues to suggest a maturing expansion, this month's very positive JOLTS report - if the trends from the last expansion repeat themselves - suggests that job growth has a ways to go.

Bonddad Wednesday Linkfest

We'll be doing our regular Monthly economic review on Thursday, April 28th at 3PM CST.  You can sign up at this link.


JOLTS quits and hires


Monday, April 4, 2016

Time to Move Into Brazil?

Disclaimer: The information contained in this presentation is provided for informational purposes only and is not intended to substitute for obtaining advice from a financial adviser or attorney

Presentation of the information via the Internet is not intended to create, and receipt does not constitute, any formal professional relationship. 

Accuracy of Information: While we use reasonable efforts to furnish accurate and up-to-date information, we do not warrant that any information contained in or made available through this website is accurate, complete, reliable, current or error-free.

Brazil is in the middle of a very serious political crisis along with a terrtible economic situation.  Yet the weekly chart of the Brazilian ETF shows prices have moved through key resistance.  Does this mean it's time to start nibbling at this ETF?

Let's start with the positve by looking at the weekly chart of the EWZ:


There are two key bullish developments: prices breaking a downtrend that started in 3Q14 along with plenty of upside momentum "room to run."  The former indicates we're seeing traders begin to take at least small positions in this ETF in anticipation of a rebound.  Furthermore, the MACD indicates this ETF could rally to a considerable degree.

Now for the bad news: the country is in terrible shape.  First of all, the current president faces impeachment.  Other members of the government are embroiled in a very large corruption scandal and the judiciary is under popular fire.  I make no predictions about the potential outcome.  I only note this in a very large crisis that endangers the entire political culture.

Second, the economy is in terrible shape:


Taking the charts in top to bottom order:

  1. The economy has contracted for a year.  Remember that the textbook definition of a depression is six consecutive quarters of contraction.
  2. Unemployment is increasing.
  3. Prices are rising,
  4. So the central bank increased interest rates to 14%, essentially slamming on the brakes to tame price increases.
Everyone wants to buy low and sell high.  What they often forget in that equation is that in order to buy low, they typically have to take on a tremendous amount of risk.   The Brazil ETF represents a tremendous opportunity but also a very high degree of the following types of risk: economic, inflationary and political.  

Only take a position in the EWZ if you can lose every penny you in invest in the position.  It could all go to hell tomorrow.


Stock prices don't lead corporate profits - it's the other way around


 - by New Deal democrat

I've been saying this for several years, and the relative performance of corporate profits and stocks in the last year has certainly borne this out.  My Q1 update is up at XE.com .

Bonddad Monday Linkfest

We'll be doing our regular Monthly economic review on Thursday, April 28th at 3PM CST.  You can sign up at this link.


EU Industrial Prices


UK Construction Activity


Sunday, April 3, 2016