


If they get "less bad," that is more evidence that this has been an inventory correction that won't grow into an actual recession.
From Bonddad:
A few points:
Here's a 5-year chart of the US dollar:

The overall level has moved lower since the end of last year. But the real test will be a move below the ~93.75 level. With the Fed on the sideline for now, that's a distinct possibility.
I'm not completely sold on the rebounding commodities story.
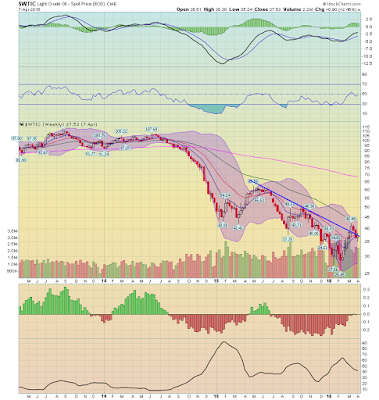
The weekly oil chart is still very bearish. While prices broke through upside resistance a few weeks ago, they have since retreated below important technical levels. I'd need to see a move above the 50-week EMA to be sold on the rebound or bottoming story.
Industrial metals have a similar weekly chart to oil:

Like oil, we've seen a nice bounce. But the fundamental picture is still bearish. China is slowing, lowering their demand. The global build-out in raw material extraction over the last 5+ years is forcing basic materials companies to continue producing to at least cover fixed costs. This keeps supply flowing, adding further downward pressure on prices. So we're seeing an increase in product and lower demand occur when there is weak global demand.
I'm more comfortable with an assessment that a bottom may by in.