Wednesday, November 4, 2009

ISM Services and Nonfarm Payrolls

- by New Deal democrat

This morning the ISM reported the second part of its data for October. The Non-manufacturing (services) Index came in at 50.6, down from last months's 50.9. The employment part of the Index came in at 41.1, down substantially from September's 44.3. Needless to say, this suggests that layoffs continue apace in the services sector. There was some good news, however, as new orders continued to grow at a faster pace, and vendor deliveries slowed (which is also good news and a leading indicator).

As I reported Monday, the ISM Manufacturing Index came in at a level which has always in the past been consistent with actual job growth. Because in past recessions about 90% of job losses have been in the goods-producing sectors, actual improvement in those sectors was enough to carry the entire economy into job growth.

What has been different in the "Great Recession" is that fully half of all job losses have come in the services sectors. I've posted a chart several times, pointing out that ~3.5 million of the ~7.0 million job losses after August 2008 came from services. Here is that picture graphically:
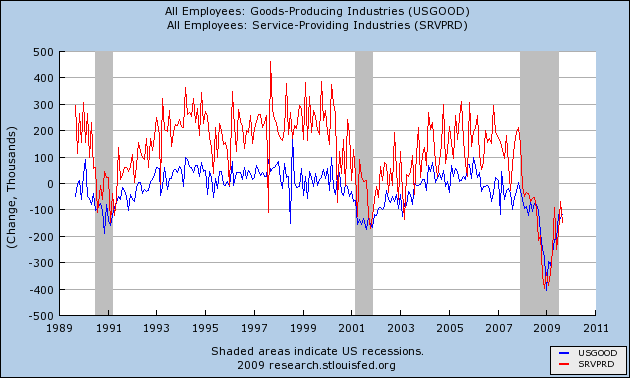
You can see that in the previous mild recessions and "jobless recoveries" of 1991 and 2001, service jobs (red) were relatively unscathed, and recovered first, while goods-producing jobs (blue) felt the brunt of the downturns and recovered last.

Not so this time. Service jobs have felt the full force of this very deep recession, for the full last year. So even if, as I suggested Monday, manufacturing is having a V shaped recovery, that doesn't mean the entire economy is participating. In fact, today's ISM services report virtually guarantees that.

I characterized the ISM manufacturing index report Monday as a "blowout." Here is a graph showing how the overall index (blue) as well as the employment sub-index (light green) in that report stacks up compared with the "jobless recoveries" coming out of the last two recessons, together with jobs (red):
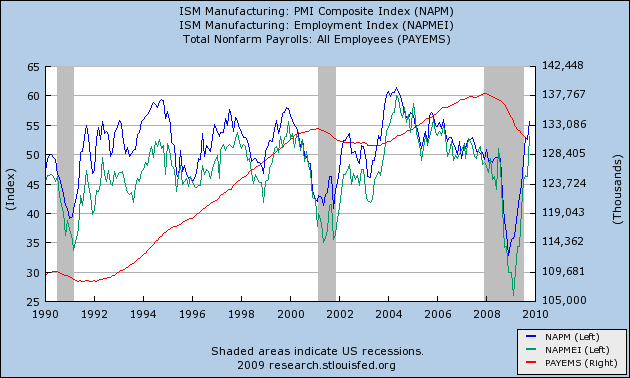
Note that both the blue and light green lines are already at levels they did not reach until well after both the post-1991 and post-2001 recoveries were underway. Specifically, they are already at levels that post-date the times when job losses had stopped, and employment was actually growing.
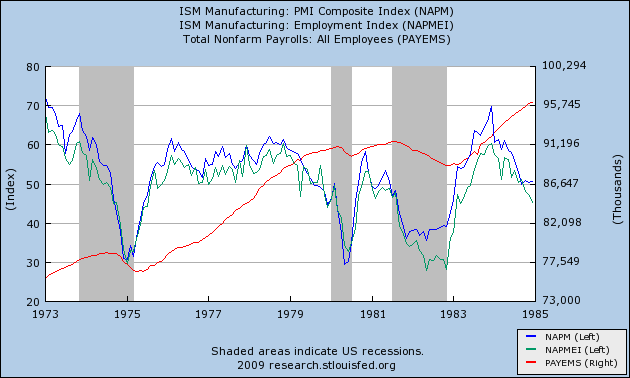
And here is a graph, showing the same thing as to the very deep 1974, 1980, and 1981 recessions:

That brings us back to the ISM services index. Unfortunately, it suffers from the same problem as the "JOLTS" index that some bloggers have been highlighting -- it is only a little over a decade old, and only gives us information about the very shallow 2001 recession.

This graph shows the ISM manufacturing index (as above in blue), together with the ISM services index (in orange) and payrolls (in red):
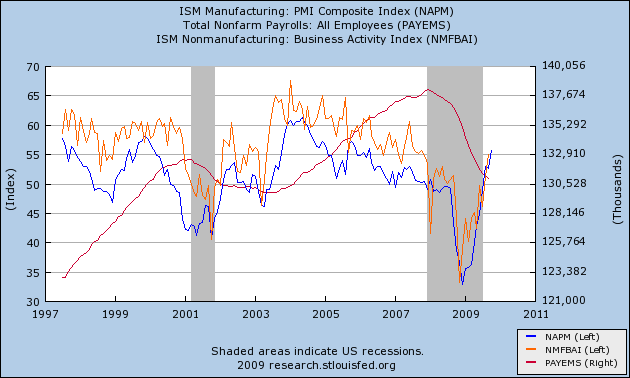
Note that the limited data we have from the last "jobless recovery" indicates that the index had to reach ~60.0 before employment stabilized. The service employment subindex doesn't get graphed by the St. Louis Fed, so I can't show it to you, but I can tell you that it never went below 43.9. Between that reading and 50.0, gains in the sub-index generally coincided with service sector job gains, and declines coincided with job declines.

In this recession, by contrast, the employment sub-index troughed at 31.1 last November, and as of September was still at a reading of 43.4.

I feel much less comfortable making a projection from such limited data, but if we accept it as a best guess, than this morning's report suggests that Friday's October employment/unemployment reports will show little improvement over the last few months'. On the bright side, there may indeed be a "V shaped jobs recovery" in manufacturing, and we may see a positive print for manufacturing jobs. On the negative side, the recovery in the services sector where 85% or more of Americans now work, has at least begun as a "jobless" one.

Why the difference? In manufacturing, quick deep cuts in employment with lean inventories have become the norm. Employers may have cut too deeply and with the snapback in new orders, may need to hire back quickly as well. With services, it's the opposite story. Here's a graph I posted a couple of months ago comparing retail sales with employment:
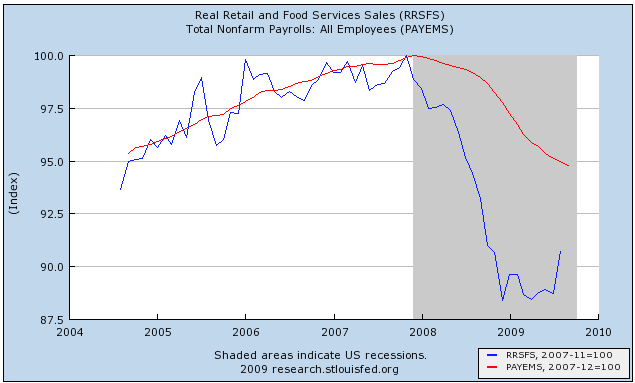

Do retail employers really need 95% of the previous workforce to sell 90% of the previous number of goods? No, and it appears that layoffs will continue in the services sector until those two lines meet, either by sales picking up, employment going down, or a combination of the two.

In that regard, there has been some good news about October retail sales in the last few days. I anticipate discussing that, and updating my "When Will the Economy Add Jobs" series early next week, after this Friday's official jobs data.

----------
P.S. H/t to commenter Brodero who points to an ISM model by Danske Research, whose report on Monday's manufacturing number concludes:

[W]e believe that there is more upside to the ISM index. Our hard-data based inventory demand ratio is to indicating a heavy production back-log in the US economy. This measure of future manufacturing activity is currently sending the most positive signal for the ISM seen in the past 40 years. Furthermore, this is supported by our model, which provides a year-end target for the ISM at 60 and indicates some possibility of even further strength early next year. That said, the recent deterioration in the ISM new orders-inventory ratio suggests that future improvement is likely to happen at a slower rate. In summary, today’s report underpins our forecast for around 4% GDP growth in the current and the coming quarters driven by substantial positive contributions from slower inventory depletion.


Needless to say, an ISM Mfg. number of 60 with +4.0% GDP in the next few quarters is very bullish for job creation.

On Financial Reform

There are now efforts on the Hill to do something about the financial system. While some bemoan the fact this has not happened yet, my guess is the administration simply put health care reform first on the agenda for whatever reasons.

So -- what do we do about the financial system?

Let's start with two observations.

The first is the financial system stands at the middle of the economy. Often times the phrase "financial intermediary" is used to describe a bank or other financial player. These companies take individual finances like small savings accounts and pool them into larger amounts of money that then go to finance large projects. Hence, they act as intermediaries. In addition, the Federal Reserve effects the economy through these institutions. These actions by the Federal Reserve fundamentally impact the direction of the economy. Because of the unique roll these institutions play in the economy they must be looked at differently. At a minimum, these institutions must be functioning at a basic level in order for the US economy to work.

Secondly, there are different types of intermediaries that are largely classified by the type of risk they undertake. As an example, take an investment bank which is

A financial intermediary that performs a variety of services. This includes underwriting, acting as an intermediary between an issuer of securities and the investing public, facilitating mergers and other corporate reorganizations, and also acting as a broker for institutional clients.


and compare that to a standard bank which "borrows short and lends long" meaning they take in deposits, pool them and make loans with the pooled money. Notice these institutions still perform financial intermediation, but perform the roles in far different manner.

The second Glass Steagall (which was repealed with the Gramm Leech Bliley Act in 1999) prevented different financial intermediaries from participating in certain other types of financial intermediation. For example, a commercial bank -- which lent money to corporations/larger borrowers -- couldn't own a brokerage company/investment bank. The reason is these types of financial companies had very different risk profiles. While the commercial bank did take on risk it was usually far less than an investment bank's risk. Hence, by preventing certain types of companies with a certain risk profile from owning another company with another risk profile, the legislation essentially prevented risk from being centered in one or more institutions -- more commonly referred to as "too big to fail".

Here's an example. Sometime over the last few years Bank of America -- a bank -- purchased Merrill Lynch -- an investment bank. This could not have happened under the old Glass Steagall act but can happen now. Also note the different financial services each offers. Bank of America takes in deposits and makes loans whereas Merrill Lynch is a brokerage company the buys and sells securities along with other, riskier investment banking operations.

The primary benefit of Glass Steagall is separation/segregation of risk. The act essentially prevents risk from being concentrated in a small group of institutions at the center of the economy. However, there is a drawback -- and it is a large drawback. It prevents "one stop shopping" for financial services. For example, large company X needs a variety of financial services such as general corporate banking and investment banking. By preventing consolidation, the Glass Steagall act does not allow larger companies to consolidate operations, thereby lowering costs through economies of scale.

Let's return to the Bank of America/Merrill Lynch example. By combining services, Bank of America can now service a larger group of clients (individuals to companies) and perform a far wider swath of services (banking and investment banking). While this does combine risk it also allows the company to increase its customer base and lower cost through economies of scale.

Many have blamed the repeal of Glass Steagall as a primary driver of the financial meltdown that started in 2007. Hence putting it back in place should be part of financial reform. The repeal of Glass Steagall was clearly a factor. But suppose that instead of occurring in a lax (or non-existent) regulatory environment, regulators had been far tougher on larger institutions. For example, suppose simple mortgage under-writing standards were more stringent (like actually requiring a meaningful down payment for a house). Would that have prevented the melt-down from occurring? There is no answer for that. However, the point is there is more than one way to look at financial reform.

Wednesday Commodities Round-Up


Click for a larger image.

A.) Gold spent three months consolidating in a triangle pattern.

B.) Gold breaks out on strong volume.

C.) Gold consolidates original gains.

D.) Gold gaps higher on strong volume

E.) Gold consolidates gains

F.) Gold again breaks out on strong volume

Notice that throughout this process the EMA picture has remained constant: the shorter EMAs were above the longer EMAs.

Tuesday, November 3, 2009

Today's Market


Click for a larger image

A.) Prices have dropped from 110.31 to a low of 103.08 -- a decrease of 5.9%.

B.) Prices are below all the EMAs. However, they are right below the 50. Also note that prices have formed a bullish engulfing pattern. This could indicate a reversal of trend. Finally, the 10 and 20 EMAs are moving lower and the 10 day EMA has crossed below the 20.

C.) Momentum is decreasing for the SPYs despite the upward trend of prices.

D and E) Notice the RSI printed a lower total on the latest top.

More on the ISM Number

Here are some key points from yesterday's ISM number:

The recovery in manufacturing strengthened in October as the PMI registered 55.7 percent, which is 3.1 percentage points higher than the 52.6 percent reported in September, and the highest reading for the index since April 2006 (56 percent). A reading above 50 percent indicates that the manufacturing economy is generally expanding; below 50 percent indicates that it is generally contracting.

A PMI in excess of 41.2 percent, over a period of time, generally indicates an expansion of the overall economy. Therefore, the PMI indicates growth for the sixth consecutive month in the overall economy, as well as expansion in the manufacturing sector for the third consecutive month. Ore stated, "The past relationship between the PMI and the overall economy indicates that the average PMI for January through October (44.6 percent) corresponds to a 1.1 percent increase in real gross domestic product (GDP). However, if the PMI for October (55.7 percent) is annualized, it corresponds to a 4.5 percent increase in real GDP annually."

ISM's New Orders Index registered 58.5 percent in October, 2.3 percentage points lower than the 60.8 percent registered in September. This is the fourth consecutive month of growth in the New Orders Index. A New Orders Index above 48.8 percent, over time, is generally consistent with an increase in the Census Bureau's series on manufacturing orders (in constant 2000 dollars).

ISM's Production Index registered 63.3 percent in October, which is an increase of 7.6 percentage points from the September reading of 55.7 percent. An index above 50.4 percent, over time, is generally consistent with an increase in the Federal Reserve Board's Industrial Production figures. This is the fifth consecutive month the Production Index has registered above 50 percent.

ISM's Employment Index registered 53.1 percent in October, which is 6.9 percentage points higher than the 46.2 percent reported in September. This is the first month of growth in manufacturing employment following 14 consecutive months of decline. An Employment Index above 49.7 percent, over time, is generally consistent with an increase in the Bureau of Labor Statistics (BLS) data on manufacturing employment.

Overall, this isa very good report. New Deal described it as a blow-out. While I am loathe to use hyperbole when writing about economic numbers, I would say this is an incredibly positive number across the board. And the internals are especially positive.


Last Post on This, I Promise...

I would have included what follows in my initial Clarification, but it actually wasn't published until after I'd written that piece, and I couldn't access it.

Legendary Dean of Market Deans Bob Farrell summed up perfectly today what concerns me -- and should concern us all:

If bubbles are created by the indiscriminate use of credit, the next big excess must surely be developing in Washington. We used to think spending forecasts in the billions of dollars was a lot of money (and debt). Today, billions are like pennies and the politicians talk in trillions as if they could grasp the meaning of such astronomical numbers. Unlimited spending and debt, almost certain increases in taxes, and bigger and bigger government are bubble-like ingredients that can only be damaging over the long run. We appear to have reached a tipping point where “growth” by government fiat is considered preferable to growth through private investment. As we move in this direction and toward wealth redistribution there is hardly a “business as usual” to return to after our systemic credit scare recession. The last bubble was created by excess use of leverage to bid up assets in the private sector. What we are facing is undisciplined debt creation (spending) in the public sector. We know from experience the pain caused by the private sector debt bubble. We can only guess what runaway public sector debt will do to our ability to grow in the future. We suspect our markets do not know either and that the “Washington Bubble” is not yet priced into our markets. We are not smart enough to know the answers either but until there is more clarity to the consequences of our public profligacy and government intervention we think markets will continue the wide swinging volatility of the past decades. This is another reason we default toward the market models of the US in the late 1930s and Japan in the 1990s as we have for some time. There may be more upside in the next few months but with the uncertainties about 2010 already increasing, the 60% gain so far since March may well be the major part of the upside.

As I mentioned previously, I get all the Keynesian stuff, but where, exactly, is this bridge taking us, and what's going to take us from there? I continue to come back to the consumer -- 70% of GDP -- and continue not to like what I see.

Treasury Tuesdays


From a broader perspective, here are the broad parameters of the Treasury market.

A.) In general, prices are trading between two broad trend lines.

B.) A mini-rally started at the beginning of August. Prices have now broken through the trend line.

C.) There is a third trend line providing both support and resistance.


Looking closer at this chart we see:

A.) The EMAs are bunched together indicating an overall lack of direction for the market.

B.) Prices fell through support yesterday.

Treasury's are caught between a rock and hard place right now. The issuance calendar is huge which should be sending prices lower in a big way. Yet yields remain low by historical standards and there have not been any problems digesting the issuance so far.

An Observation on ISM (Manufacturing) and NFP

I was fiddling with some numbers today (what else is new?), and decided to further explore the relationship between ISM Manufacturing and Nonfarm Payrolls.

Here is what I found:


It would appear there is -- or has been until now -- a very high correlation between PMI Manufacturing (Blue, Left Hand Scale) and the Year-Over-Year Percentage change in Nonfarm Payrolls (Red, Right Hand Scale). That relationship has disintigrated in this cycle, as PMI turned up while employment continues to fall. This is a very troublesome chart. What it shows us, I think, is that the government can exercise some influence over production (e.g. Cash for Clunkers, homebuyer tax credit, both of which supported their respective industries), but it simply cannot exert sufficient influence over the labor market to make any meaningful difference. And, again, what happens as the life-support is removed?

Monday, November 2, 2009

Today's Market

Click on all images for a larger image.

First, consider this chart of the VIX.


Notice the big spike upwards over the last few days. That tells us to expect more volatility. Now consider today's chart:


A.) Prices opened a bit higher then sold off into the 10 and 20 minute EMA. Prices rallied from this level to

B.) the 200 minute EMA. Prices couldn't make it through this number so they sold off to the 10 and 20 minute EMA. Then

C.) Prices moved lower, printing longer and stronger downward bars. This was followed by

D.) A double bottom from which prices rallied into the close.

However, notice all of the action we say in one trading session: a mini-rally, an accelerating sell-off followed by a bottom and then a move higher. That's why I brought up the VIX -- expect more of the same going forward.

Person Income And Spending

Last Friday the BEA released the personal income and expenditure report. Here's the main information in the report:

Personal income decreased $0.1 billion, or less than 0.1 percent, and disposable personal income (DPI) decreased $0.2 billion, or less than 0.1 percent, in September, according to the Bureau of Economic Analysis. Personal consumption expenditures (PCE) decreased $47.2 billion, or 0.5 percent. In August, personal income increased $17.4 billion, or 0.1 percent, DPI increased $14.1 billion, or 0.1 percent, and PCE increased $139.8 billion, or 1.4 percent, based on revised estimates.


Let's break the information down into sub-categories. Click on all images for a larger image.


Note that wage and salaries appear to be bottoming. They have been printing in a smaller range for the last four months. In addition, government transfer payments are more or less holding steady at current levels. My guess is this is the result of increased unemployment/personal assistance payments.

Regarding the actual expenditures, first consider that services account for 66% of all purchased, non-durable purchases account for 22% and durables account for 12%. That being said:


Service purchases have been increasing since May.


Non-durable purchases were decreasing until July but have risen strongly the last two months. Remember -- these aren't durable (as in cash for clunkers).


Here we see the impact of cash for clunkers -- a big spike followed by a fall.

But also notice that we have other areas of spending increasing.

Point of Clarification

To be crystal clear on where I stand:

1) My primary concern is -- and always has been -- about the "handoff" or sustainability of growth. I think we can all agree that the government can't -- and shouldn't -- prop up the economy indefinitely. I get all the Keynesian stuff, but the government "bridge," such as it is, has to let you off on the other side at some point. My visibility as to where that might be is still extremely hazy.

2) I was for the stimulus package. In fact, I was for a bigger stimulus package. And while I'm not bemoaning -- only pointing out -- that last week's 3.5 print was largely government subsidized, I always seem to be left wondering, "Where do we go from here?" What is going to be the driver, the growth catalyst, to get GDP back up the sustainable trend (~3.0 or so) we require to get to fuller employment and see some wage growth? This is something that could have been -- should have been -- under discussion six months ago and is, as best I can see, still not.

3) My concern about sustainability is focused on the consumer. To that end, the following appeared in a piece of Merrill Lynch research last week:

What will sustain the recovery?
Take a look at page A2 of today's Wall Street Journal, "Consumers Unlikely to Keep Pace". Here is what the Journal says: "Consumers helped propel the U.S.'s economic growth in the third quarter, but unemployment and tight credit are hampering their ability to lead a sustainable recovery - and it isn't clear what part of the economy can replace them." We would just point out that a 3.0%+ run-rate on consumer spending is not the deciding element in our forecast for a sustainable recovery. This is going to be a recovery driven by exports, inventory de-stocking, and business investment, in our view.

Now, the three items the Merrill team cites may, in fact, produce a "recovery." But now we're getting into semantics, because what those three factors can reasonably produce, over time and absent robust consumer participation, will be nothing more than the most muted, jobless recovery our country has ever seen.

I know Bonddad wasn't pointing a finger at me. We speak almost daily and we know exactly where each other stands (and I think we're generally in complete agreement). It's not my intention to be a downer, but I think we need to be realistic about what's ahead and how we're going to address it. The government simply cannot carry the ball forever, on that I think we'd all agree. In a nutshell, we need to figure out how we're going to put people back to work.

(I see Paul Krugman has a post up at his blog that speaks to the points I'm trying to make. It addresses what recovery "should" look like, and cites another post that's spot-on.)

ISM Manufacturing, Employment Indexes' Blowout suggest Job Growth!

- by New Deal democrat

The October ISM Manufacturing Index report is out, and it's a blowout. This is as good as it gets, there is definitely a V shaped recovery in manufacturing underway.

The overall index grew to 55.6 from last month's 52.6. (In this report, numbers over 50 represent expansion; numbers under 50 indicate contraction). This is the highest reading since April 2006.

New orders continued to grow, at 58.5, but at a slower pace than last month's 60.8. Production grew at 63.3 vs. September's 55.7. Inventories, at 46.9, are still contracting (a good sign). Supplier deliveries slowed from 58.0 to 56.9 (also good).

Perhaps most importantly of all, for the first time in ages, employment actually grew, at 53.1 vs. last month's 46.2. Additionally, 20% of employers reported plans to hire workers, and 64% who planned on stable workforces, for a total of 84, vs. 15% who planned layoffs, for a net +4 in the index.

At no point during the 1992-3 and 2002-3 "jobless recoveries" did the ISM manufacturing index ever rise to 54 or above. A number above 54 has always meant job growth in the overall economy. Likewise, an employment subindex reading of +4, and hiring plus stable reading of 75 or higher have always meant actual job growth in the economy.

In short, if October 2009 is like all prior post WW2 recoveries, the ISM readings would mean actual job growth in Friday's nonfarm payrolls report.

Because unlike prior recessions, over half of all job losses during the "Great Recession" were in services, however, we still need to see what the ISM service index shows on Wednesday before we can dare to hope that Friday's October jobs number might actually print positive.

Market Monday's

As I started to note last Tuesday and again on Wednesday the market's are still in a technically weak situation. Consider the following charts:


The SPYs have broken through key technical support and


have decreasing momentum. In addition


Notice that prices have been decreasing on (A) increasing volume. Prices are now below the 10, 20 and 50 day EMAs. In addition, the 10 and 20 day EMAs are moving lower and the 10 has crossed below the 20.

The big problem is the sell-off is occurring across all markets.


A.) The Russell 2000 formed a double top. This is a classic reversal pattern.

B.) Prices have fallen below the mid-point between the two tops on

C.) increasing volume. In addition

D.) The 10, 20 and 50 day EMAs are moving lower, the 10 day EMA has moved through the 50 day EMA and prices are below the 10, 20 and 50 day EMA.


A.) The Transports also formed a double top.

B.) Prices have fallen below the mid-point between the two tops on

C.) increasing volume. In addition

D.) The 10, 20 and 50 day EMAs are moving lower, the 10 day EMA has moved through the 50 day EMA and prices are below the 10, 20 and 50 day EMA.

The one good thing about the transports chart is it is approaching the 200 day EMA for technical support. But if it falls through that line, we've got problems.


A.) The QQQQs broke upside support some time ago and

B.) Prices are falling on increasing volume


A.) The 10 and 20 day EMA are both moving lower and the 10 day EMA has crossed below the 20 day EMA

B.) Prices have moved through the 50 day EMA on

C.) increasing volume.

Bottom line: this is a market that is looking to move lower.

Friday, October 30, 2009

Weekend Weimar and Beagle

It's that time of the week. It's time to think about anything except the markets and the economy.

We'll be back on Monday. Until then:

Weekly Indicators

This was a terrific week for past news about the economy, as GDP was reported to have increased 3.5% in the Third Quarter, which ends (reasonable)talk of the "Great Recession" and focuses on the strength and sustainability of the Expansion.

Monthly reports for October were more mixed. New home sales unexpectedly declined, although within the range of "noise" in the uptrend since the bottom at the beginning of this year. Personal income was flat (a troubling sign) and spending declined. The University of Michigan consumer sentiment barometer increased in the second half of October, but is down for the month. On the other hand, durable goods orders advanced more than expected. The Chicago PMI also jumped to 54.2, which bodes well for Monday's ISM national manufacturing report for October. Production jumped to 63.9, New Orders to 61.4, and supplier deliveries to 50.7. Employment, unfortunately, lagged and was virtually unchanged at a depressing 38.3.

Likewise, Edmunds.com reported that October auto sales "look to be on track for Seasonally Adjusted Annualized Rate (SAAR) in the low 10 million range." That would still make October the third best month this year, and demonstates that cash-for-clunkers didn't decimate future demand. Here's the monthly chart since the February bottom:

2009-02-01 9.143
2009-03-01 9.690
2009-04-01 9.203
2009-05-01 9.848
2009-06-01 9.672
2009-07-01 11.223
2009-08-01 14.072
2009-09-01 9.191

Most of the high-frequency weekly data, however, was good.

Same store retail sales for the week ending October 25 were up again both YoY and WoW, a very good sign for continued consumer spending:

WEEK ENDING INDEX 1977=100 YEAR/YEAR CHANGE WEEKLY CHANGE
(percent) (percent)
Oct 25 490.8 2.4 0.1
Oct 17 490.3 2.8 0.2
Oct 10 489.4 1.0 0.6
Oct 3 486.5 1.0 0.3

The Edmunds.com and same store retail sales numbers are also good news for the "real retail sales" number for October. I have previously described Real retail sales as the "holy grail" leading indicator for job growth.

In a similar vein, New Jobless Claims held steady at 530,000, while the 4 week moving average declined to 526,000. This is more than 20% lower than the peak number from 7 months ago, and if maintained another month or so, may mean that the bottom for jobs in the economy is at hand.

On the other hand, ShopperTrak "reported that year-over-year GAFO retail sales declined 4.0 percent for the week ending October 24 while sales fell 4.8 percent versus the previous week ending October 17." The release explained that "sales declined last week as Columbus Day sales and promotions ended and retailers experience the annual lull leading up to Halloween."

Railfax showed all rail traffic except for cyclical traffic increased for the last week, which is impressive since all sectors should have already begun their seasonal decline. Even cyclical traffic declined less than it did last year, so a year-over-year weekly improvement.

Meanwhile, truck traffic declined slightly from August to September, but September was still the second best month all year. As the graph below shows, the trend is clearly still up from earlier this year.

Some of the increase also appears to be seasonal.

Finally, the price of Oil meandered around the $80 mark, a threat to the incipient economic expansion.

Some Final Thought on GDP

While I was personally very happy withe the GDP numbers, perhaps the best source of entertainment was the reaction to them. Reaction fell into a few camps.

1.) "I complain therefore I am". People -- a large percentage of whom argued for the stimulus and in some cases are arguing for more -- are now complaining that government spending was responsible for some of the growth. Here's a news flash: we're in the middle of a pure Keynsean period where the government is supposed to ameliorate the impact of the recession and help us get back to a period of full employment. That is one of the central themes of Keynes arguments. In addition, consider that government spending usually accounts for about 20% of economic growth. Do we now completely discount this part of the GDP equation going forward?

2.) "GDP doesn't matter or is a bad indicator of economic activity." Since when? We've been using this number for a really long time. Here is the basic definition:

The monetary value of all the finished goods and services produced within a country's borders in a specific time period, though GDP is usually calculated on an annual basis. It includes all of private and public consumption, government outlays, investments and exports less imports that occur within a defined territory.


It tells us lots of incredibly important information. But now it's flawed? Please. If you want to look at other parts of the economy -- like quality of life etc. -- there are plenty of statistics already available. But don't tell me that because GDP doesn't include quality of life issues or because it doesn't favor certain types of activities over others that it's somehow flawed. That's plain bullshit. What they're really saying is "I know squat about how economic numbers work together. But I really want people to think I do. So to hide my ignorance I'll just say all the numbers are bogus and use a made-up number that can't be empirically verified that also jibes with my point of view."

Here's the basic deal: the government spent money and initiated programs to get the economy moving forward. Guess what? It worked. That's because it was designed to work that way.

GDP, Part III -- Invictus' Take

The money shot of yesterday's surprisingly strong GDP print was this, in my opinion:

"Motor vehicle output added 1.66 percentage points to the third-quarter change in real GDP after adding 0.19 percentage point to the second-quarter change."

That addition -- 1.66 points -- can be found in BEA Table 1.2.2, on Line 15. Without Motor vehicle output -- Line 16 -- GDP would have come in at 1.88 percent.

But let's look at the historical record, because it tells an interesting story.

Going back to 1975 -- 139 quarters -- Motor vehicle output has averaged a +0.09 percentage point contribution to GDP. That's it. It has exceeded 1.50 percentage points -- as it did today -- in exactly 12 previous quarters. That's it. About 9 percent of the time does this line print greater than 1.50.

Further, in the 12 previous quarters in which Motor vehicle output printed 1.50 or greater, the subsequent quarter fell back, on average, to +0.14.

So, given the expiration of C4C -- and notwithstanding some extension/modification of the first-time homebuyer tax credit -- how are we going to replace the inevitable artificial goosing of GDP we saw in today's numbers?

Forex Fridays


The dollar is still very clearly in a downtrend. However at (A) we have a possible move through the trend line which would send prices higher. The vast majority of this chart is still very negative: prices are in a clear downtrend; the eMAs are negatively configured. While the 10 and 20 day EMAs have moved higher this is a preliminary move that needs more traction before we give it compete credence.

Thursday, October 29, 2009

Today's Market


A.) Prices gapped higher at the open on strong volume. Prices then found support at the 10 minute EMA and moved higher.

B.) Prices hit resistant at the 200 minute EMA and traded there for about an hour. They eventually moved through resistance.

C.) Prices continued to find support at the 10, 20 and 50 minute EMAs for the remainder of the day.


While today's rally is good news because it takes us away from the precipice, the chart shows we are not out of the woods by any stretch. Prices are still below the 10 and 20 day EMAs and the 10 and 20 day EMAs are clearly moving lower. In addition, today's volume isn't as impressive as the volume we saw on the sell-off over the last few days. In addition, consider these two other charts:


The Russell 2000 is still in serious trouble. It's printed a double top and prices are simply hanging on just above support. The 10 and 20 day EMAs are moving lower and the 10 day EMA has crossed below the 20 day EMA. In addition, prices printed long bars on the way lower on high volume.


Everything regarding the IWMs above applies to the Transports with the added caveat that the 10 day EMA is about to move through the 50 day EMA.

GDP Up 3.5% Part II

Let's look at the GDP report from a different angle -- the percentage increase and what each component of GDP added to GDP growth.

First, GDP increased 3.5%.

Durable good sales added 1.01 of the 3.5% or 29% of the total increase. That number is the result of C4C. That number is also highly unusual -- meaning it is way out of the ordinary. The highest that number had been since the 4Q05 was .46 -- and that number was also out of the ordinary. Suffice it to saw we're not going to get a goose like that from this number again.

Non-durable goods added .31 and services added .57. So combined these two other areas of growth were responsible for .88 of GDP growth, or 25%. This is why the broad based increase in PCEs (mentioned below) is so important. While car sales were a reason for the increase, they weren't the only reason.

Gross private domestic investment added 1.22 to the 3.5. The big movers there were positive contributions from the change in private inventories and increases in residential investment.

While exports did increase, imports also increased meaning we're back to imports subtracting from growth.

That leaves government spending which added .48 of to the 3.5.

While C4C was a boost, it wasn't the only are that helped. There were other reasons for the increase.

GDP Up 3.5%

The long awaited report is out. I'm going to spend the rest of today (and probably some time tomorrow) on this. The GDP report provides a ton of incredibly useful information about the economy and what is going on.

Let's start with the basics:

The increase in real GDP in the third quarter primarily reflected positive contributions from personal consumption expenditures (PCE), exports, private inventory investment, federal government spending, and residential fixed investment. Imports, which are a subtraction in the calculation of GDP, increased.


Here's an important point: yes, cash for clunkers was a big reason for the increase. But there were other contributors as well.

Real personal consumption expenditures increased 3.4 percent in the third quarter, in contrast to a decrease of 0.9 percent in the second. Durable goods increased 22.3 percent, in contrast to a decrease of 5.6 percent. The third-quarter increase largely reflected motor vehicle purchases under the Consumer
Assistance to Recycle and Save Act of 2009 (popularly called, “Cash for Clunkers” Program). Nondurable goods increased 2.0 percent in the third quarter, in contrast to a decrease of 1.9 percent in the second. Services increased 1.2 percent, compared with an increase of 0.2 percent


Yes the cash for clunkers program was a big goose. But notice it wasn't just durable goods that saw increases: non-durable goods and services also increased. And not by small amounts. Also note the durable goods purchases by consumers only comprise 12% of PCEs. Services are by far the biggest component of PCEs, coming in at 65.7%. And non-durable goods comprise 21.9% of purchases. That makes the 1.2% increase in services and 2% increase in non-durables very important. The increase was broad-based.

Real nonresidential fixed investment decreased 2.5 percent in the third quarter, compared with a decrease of 9.6 percent in the second. Nonresidential structures decreased 9.0 percent, compared with a decrease of 17.3 percent. Equipment and software increased 1.1 percent, in contrast to a decrease of 4.9 percent. Real residential fixed investment increased 23.4 percent, in contrast to a decrease of 23.3 percent.


This is more good news for two reasons.

1.) The rate of decline of non-residential fixed investment dropped at a smaller rate. We saw a slight increase in equipment and software investment.

and

2.) Residential investment increased at a strong rate. Now I'm guess that some of that increase is the result of coming off a low bottom. But not all.

Real exports of goods and services increased 14.7 percent in the third quarter, in contrast to a decrease of 4.1 percent in the second. Real imports of goods and services increased 16.4 percent, in contrast to a decrease of 14.7 percent.


While imports increased at a larger rate than exports, exports were still up 14%. That tells us that our trading partners are buying things -- meaning they are recovering. The increase in imports indicates we're recovering.

Simply put, this is a good report.

Thursday Oil Market Round-Up


A and B.) Notice there are two upward sloping trend lines that emerge from the bottom earlier this year. The first one (A) has now become overhead resistance. The second one (B) is still in place.

C.) Prices consolidated in a triangle consolidation formation.

D.) Prices broke out of this formation three weeks ago

E.) The RSI is not overbought right here. This is very interesting.

F.) The MACD is moving slightly higher. But also note it is coming off of an extremely overbought condition in mid-2008 and a very oversold condition at the end of 2009/beginning of 2009.


A.) Notice that the $73-$75 area was a huge supply area for about 4 months. That's a long time to hold resistance. Remember -- the longer a trend the more important its breaking.

B.) Prices broke through upside resistance earlier this month.

C.) Prices peaked and are now retreating a bit. Also note the bullish EMA picture -- shorter about longer and all rising. However, the 10 day EMA is about to move lower.

D.) The RSI is retreating and

E.) The MACD is about to give a sell signal.

Ideally, oil prices are supposed to rise in the spring for the summer driving season and then fall after Labor day. That didn't happen this time around -- prices spiked after labor day.

This is a conflicted situation -- the weekly chart says we're moving higher and the daily chart says we're going to move a bit lower.

Wednesday, October 28, 2009

Lather. Rinse. Repeat.


Today's Market

The market is breaking down technically. Consider the following:


A.) The DIAs have broken a long-term uptrend on increasing volume.


A.) The QQQQs have broken an uptrend that lasted six months.

B.) The QQQQs have broken to the downside with longer and stronger bars on increasing volume.


A.) The IWMs formed a double top

B.) The IWMs broke through long-term support

C.) Prices broke through the lowest price between the two tops

D.) Prices are moving down with longer bards on stronger/rising volume.

Tomorrow's GDP report is that must more important now.

Transports Are Sending Bad Signals

I'm a big fan of Dow theory. It basically says that markets have to move in tandem. It makes intuitive sense as well. When the economy starts to grow, all sectors have to participate. Business has to move more stuff from point A to point B. As a result transport companies should see an increase in earnings. The logical outcome of this theory is the work of John Murphy whose book "The Technical Analysis of the Financial Markets" basically says all markets (stocks, bonds, commodities and currencies) are inter-related.

Anyway, the reason I mention this is the transports aren't looking that good right now.

Let's start with the weekly chart:


Click for a larger image.

There are two key points.

-- Prices have broken a long upward sloping trend line and

-- The MACD is about is give a sell signal.

Let's add the daily chart:


Click for a larger image

First notice the chart has probably printed a double top. This is a reversal formation -- one of the main chart events we look for.

Secondly, I've broken the chart down into two boxes box A and box B. Notice that box B is technically weaker than box A -- both the MACD and RSI have printed weaker numbers.

Third, notice point C. Prices have moved through all the EMAs and a trend line. Also note the 10 day EMA has moved through the 20 day EMA -- another bearish development.

Yesterday I noted that several broad markets are sending sell signals. The transports were one of these markets. Putting all of these elements together it looks like we are heading for a correction. However, it's very important to remember this is a technical read; it is one side of the equation. It is not an analysis of the fundamental side of the equation. We still have a very important GDP print tomorrow which could completely reverse all of this information.

My best guess about what is happening is traders are taking some money off the table in anticipation of a weak GDP print tomorrow. They've made some great profits; now its time to recognize some of those profits.

Wall St.'s Months of Joy Not Felt On Main St.

scroll down for the commodities charts

Wall St. Journal (posted online Tuesday evening):

Americans are growing increasingly pessimistic about the economy after a mild upswing of attitudes in September. But Republicans haven't been able to profit politically from the economic gloom, according to a new Wall Street Journal/NBC News poll.

The survey found a country in a decidedly negative mood, nearly a year after the election of President Barack Obama. For the first time during the Obama presidency, a majority of Americans sees the country as being on the wrong track.


The reason that politicians of all stripes are currently so reviled is because of their inability to get anything done, along with an attitude down in Washington that can best be summed up by a Groucho Marx skit that's almost 80 years old -- but is simply spot-on.

The bloom's off the rose, methinks.

When Economists Collide

-- INVICTUS

Those who have followed anything I’ve written over the years over at Blah3, or more recently here at the Bonddad Blog, know that I have the utmost respect for former Merrill Lynch economist David Rosenberg (now of Toronto’s Gluskin Sheff). I think Rosie’s one of the best in the business, and has always called it as he’s seen it. To his great credit, he was always unwilling to simply toe the sell-side line and blow bullish smoke up everyone’s behind, despite often catching flak for his bearish posture. He was foretelling the story of our recent catastrophe – particularly as it relates to the housing bubble – long before anyone else (including Roubini or Taleb) was onboard. And, unlike them, he was very specific about what was going to trigger the recession -- he wrote about a housing market bubble forming in August 2004 and articulated very clearly that trouble was brewing as a result of it.

When Rosie left Merrill, there was almost immediately a very subtle, very nuanced shift toward a more bullish posture. And when the announcement was made that Ethan Harris was to replace him, the bullish spin went into overdrive (how could it be otherwise when you’ve now got an economist forecasting 3%+ GDP growth for the next six quarters?).

Lately, it seems as though the rhetoric has been escalating.

Those who have followed Rosie know two things for sure about his work, since he hammered them home every chance he could (almost daily):

1) The U.S. consumer – whose Debt-to-Income ratio rose to the stratosphere in an orgy of consumption – needs to return to a more frugal existence, spending less and saving more. As I detailed recently, a mere return to the long-term trendline of Debt-to-Income implies a shedding of about $1.6 trillion of debt (reversion to the mean implies a shedding of over $5 trillion).

2) Rosie has maintained – and continues to do so – that this will be the mother of all jobless recoveries (it arguably already is given the how far we are from the recession’s starting point and the fact that we’re still bleeding jobs).

Now, Rosie’s taken his shots – broadly speaking – at economists who never saw the recession coming and are now opining about a V-shaped recovery. And he’s referred to them in not-so-glowing terms (e.g. shills, hacks, montebanks, etc.), although he’s rarely mentioned anyone by name (though once in a while he lets one fly). In all fairness, it must be pointed out that Rosie has remained steadfastly bearish in the face of the stock market’s 60% rally, and legitimate criticism could certainly be leveled against him on that front.

Now it appears Merrill has decided to retaliate against what they must perceive as Rosie’s assault against their change in perspective since his departure.

In an Oct. 9 piece that purports to refute Rosie’s view of the consumer -- A balanced view of household rebalancing – the Merrill team argues that the U.S. consumer is in better shape than folks like Rosie think, and adds this zinger for good measure: “However, our results strongly contradict some of the more alarmist views on the consumer.” It continues: “The popular press suggests an extreme deleveraging by U.S. consumers is likely. We think this view is unlikely, as households can restore their net worth in several ways. Households could choose either to pay down debt or to accumulate assets, in
order to restore their net worth.”

Their upshot: “None of this should take away from the bottom line: the extreme deleveraging predictions discussed elsewhere need not occur if households actually care much more about their net worth rather than just their debt ratio. Under what we believe are a reasonable set of assumptions, the household sector can repair its balance sheet by pushing up the saving rate to anywhere from 5 to 10%. This should restrain the growth in consumer spending in the coming years, but only by about ¼ to ¾% per year.”

The gist of the argument is that households are more focused in net worth than on debt or on debt-to-income and that, in any event, they could restore the balance by “accumulating assets in order to restore net worth.” How they could accumulate those assets in the absence of either higher incomes, lower debt, or increased savings remains unexplained. (Last I checked, assets had to be paid for somehow, or am I mistaken about that?)

In another shot across the bow (Oct. 20), they take aim squarely at the “jobless recovery” that most (led by Rosie) are forecasting:

Reasons this recovery can be particularly jobless

Turn to page A3 of today's Wall Street Journal, "Employers Hold Off on Hiring". Even though the profit outlook is improving, many companies are holding off on hiring. The WSJ points out that the situation is so bleak in the labor market that even if the economy was churning out jobs as quickly as the 1990s expansion (2.2 million private sector jobs a year), it would still take the economy until 2017 to reach a 5% unemployment rate. While hiring usually lags the economic recovery, the WSJ highlights several reasons why the outlook may be worse this time around:

1 Many businesses have doubts about the durability of the upturn and attribute much of the recent growth in orders to government stimulus and a temporary inventory rebuild.

2 Businesses face uncertainty over the regulatory outlook and the costs associated with the expansion of health care and climate legislation.

3 Companies have also been able successful at boosting productivity to make up for the sharp declines in headcount.

4 Many companies also have excess labor on hand - after cutting hours to record lows, companies can boost production simply by increasing hours without having to add existing workers.

Reasons we disagree with the jobless recovery view

Of course, the first two factors have some merit at the margin but are unlikely to be major drivers of hiring activity, in our view. The productivity argument arises after each recession and works for a time until the typical lag we normally witness in the relationship between activity and hiring kicks in. The final point is the one that is, in our view, most mistaken. Although it is true that hours have been cut to record lows, that does not mean there is excess labor. Not all labor is fungible and there could be demographic and work rule reasons why firms have chosen to cut hours rather than production in certain industries. Finally, a number of industries work with such a lean workforce that, when the downturn came, these workers saw their hours cut as the alternative was for the plant to shut down - these industries were not likely going to be the drivers of growth in the labor market under any circumstances.

I don’t find either of their arguments particularly compelling.

Yesterday, as a matter of fact, the Merrill team had to contend with what can only be described as a huge setback in consumer confidence. With economic releases looking increasingly mixed, the ML team seems challenged in support of their more optimistic view.

In any event, there most definitely seems to be a very subtle – yet discernible – to and fro taking place between Rosie and his former shop.

Wednesday Commodities Round-Up


Click for a larger image

Regarding the copper market

A.) The 40-41 was a supply area for a month and a half; prices simply could not get over this level.

B.) Starting at the beginning of October prices made another run at breaking through resistance.

C.) Over the last week prices have moved through resistance. After moving through they stopped to consolidate their gains.

D.) Momentum favors further upside moves.

Finally notice the EMA configuration: all are moving higher, the shorter ones are above the longer ones and prices are above all of the EMAs.

This is a bullish chart.

Tuesday, October 27, 2009

Today's Market

Or more importantly is the rally now in trouble? When looking at the market it's very important to consider a variety of markets; only looking at one index like the S&P 500 just doesn't work. With that in mind, consider the following charts. As always, click on all for a larger image:


A.) The SPYs have broken a long upward sloping trend line.


A.) The QQQQs have broken a long term trend line.


B.) The Russell 2000 has formed a double top and has broken a long term trend line.


A.) The transports have formed a double top and B.) have broken a long-term trend line.

We have four average that are breaking long-term trend lines. That is not good.

The Brighter Side of Defauts

From the WSJ:

One of the biggest clouds on the economic horizon is the vast amount of debt U.S. households took on during the boom years. The Federal Reserve puts total household debt, including mortgage debt, at about $13.7 trillion, or 125% of annual after-tax income, a burden that many economists believe will take several years to pare down to what they see as a more sustainable level of 100%. During that "deleveraging" process, the logic goes, U.S. consumers -- whose spending makes up more than two-thirds of the U.S. economy and about one-fifth of the global economy -- won't be able to play a leading role in any recovery.

The gloomy forecasts, though, miss an important point: Debts have value only to the extent that they are being paid, and a rapidly rising number of U.S. households aren't doing so. Those defaults are leading to losses at banks, a wave of foreclosures, trouble for neighborhoods and strife for families. But they are also providing an immediate, albeit radical, form of debt relief.

"It's not ideal, because it carries other costs," said Karen Dynan, a consumer-finance specialist at the liberal Brookings Institution think tank who recently served as a senior adviser to the Federal Reserve. But it is "going to help get household balance sheets back to the right place."

If one accounts for defaults, U.S. households' debt burden is shrinking a lot faster than the official data suggest. First American CoreLogic, which tracks the performance of mortgage loans, estimates that some 9.3% of the nation's 52.4 million mortgage holders were 60 or more days behind on their payments as of July. That represents relief on about $1.2 trillion in loans. The official data miss most of that, because the Fed doesn't erase debts until banks have foreclosed, sold the homes and taken the loans off their books, a process that can drag out for more than a year.

As a result, some economists are expecting a sharp improvement as widely watched indicators of consumers' finances catch up to reality. Joseph Carson, director of global economic research at AllianceBernstein, expects the share of households' after-tax income that goes to pay loans, rent and other financial obligations to fall to 16.3% by the middle of next year, well below the average for the 20-year period leading up to the housing boom. As of June, it stood at 18.1%.


No, I am not happy, pleased or even celebrating that this is happening. However, a logical outcome of the wave of defaults is a lower debt/income ratio which has positive long-term implications.

Case Shiller Shows Continued Improvement

From Bloomberg:

Home prices in 20 U.S. cities rose in August for a third consecutive month, bolstering the case that an economic recovery is at hand.

The S&P/Case-Shiller home-price index climbed 1 percent from the prior month on a seasonally adjusted basis after a 1.2 percent increase in July, the group said today in New York. From a year earlier, the gauge was down 11.3 percent, less than forecast.

Rising home sales, due in part to government programs including the first-time buyer credit and efforts to lower borrowing costs, have helped stem the slump in property values that precipitated the worst recession since the 1930s. Sustained gains in household spending, the biggest part of the economy, may be harder to come by as joblessness mounts.


Here are the charts from the report:


Click for a larger image.

While prices are still negative year over year, the rate of decline is improving. In addition


Only three cities printed a negative month over month growth in the latest survey. This is another positive development for housing prices.

The blog Calculated Rish has put forward the idea that housing will see two bottoms: one in the pace of sales and one in prices. I still think that's a correct assessment.

Trio Of Fed Reports

From the Chicago Federal Reserve:

The Chicago Fed Midwest Manufacturing Index (CFMMI) increased 1.0% in September, to a seasonally adjusted level of 82.3 (2002 = 100). Revised data show the index rose 1.6% in August, to 81.6.


Here is a graph of the index:


Click for a larger image.

This index isn't printing as strongly as other regional indexes, largely because the Chicago index didn't start to rise until mid-year. But it is currently moving in the right direction. It rose because three of the four components increased last month:

Click for a larger image.

Then there is the Chicago Fed National Activity Index. Here is a chart of the three month moving average:


The best news from the chart is it is now at levels associated with national expansion:


But the Dallas Fed's number dropped last month:

Texas factory activity declined in October, according to business executives responding to the Texas Manufacturing Outlook Survey. The production index—a key indicator of current manufacturing activity—edged further into negative territory, suggesting output in October contracted after remaining stable in September.


Here is the accompanying chart:


Overall the Dallas chart is also moving in the right direction; it has been in a clear upward trajectory since the beginning of the year. So far, this data point looks like an outlier to the general trend.

Overall, these three reports are good good news. We have two reports that show a brightening picture and a third that is still in an upward sloping trend.

Treasury Tuesdays


A.) The IEFs are bounded by two trendlines right now.

B.) There is a second upward trend that started at the beginning of August.

C.) There is a third trend line that is providing support for prices.

D.) Prices have moved through line C (mentioned just above).


Note that EMAs are turning bearish.

-- The 10 and 20 are moving lower.

-- The 10 day EMA has moved through the 200 day EMA; the 20 is about to.

-- The 50 is just turning negative.

-- Prices are below all the EMAs

Monday, October 26, 2009

Today's Market


Click for a larger image.

A.) Prices moved higher at the open printing some strong candles. But the volume was weak.

B.) After getting over the EMAs, prices couldn't maintain their momentum. As a result, they printed some weak bars.

C.) Within the period of of 40 minutes the market saw an increase in volume and a strong downward movement. Notice the strength of the downward moving candles.

D.) For the rest of the day prices ran into upside resistance at various EMAs.

Regarding Banker's Pay

Last week we learned that the Federal government will limit pay at banking firms.

This is a bad idea for two reasons.

First, pay is not the federal government's business. Period. It smacks of a command economy like the economies that existed in the eastern block. Those economies were at best jokes. They did succeed in making everyone equal -- everyone eventually became poor. The US is based on a capitalist model where the market sets the rates. Period.

But most importantly, this is a shareholder issue. For those of you who are unfamiliar with corporate law, the basic structure of a corporation is the shareholders are the owners of the company. They hire the board of directors who implement macro-level policy for the shareholders. The board also hires the managers who carry out the day to day operations of the company. However, this whole situation boils down to the shareholders -- it is their responsibility to vote for or against directors. It's also up to the shareholders to get rid of directors they don't like or who are not doing well for the company. If you don't like the way the company is being run you have two choices: sell your shares and stop being an owner or figure out a way to start working with other shareholders to effect change at the company.

This does lead to a second point: does US corporate law need to change? That is, do we need change the way corporations are governed? That is always a possibility. However, that is something that has to happen at the state level where corporate law is created.

Consider this passage from a blog posting of activist investor Carl Icahn:

It is unfortunate that it took a force the size of the U.S. government to shake up the board and management at GM. In effect, the government has become the world's biggest activist investor, making the same kinds of demands that any activist or creditor should rightfully make in return for its investment.

Shaking up managements and boards is a no-brainer at underperforming companies for activist hedge funds and private equity firms, including Quadrangle Group, which Rattner co-founded. Why should investors tolerate poor performance? Why should taxpayers?

I have shaken up boards and managements at many companies in which I have invested, including Blockbuster, ImClone, Stratosphere, Philips Services, Federal-Mogul and many others. Generally, but not always, the net result has been very positive for the company and the shareholders. It is important to get new blood, new strategies and new ideas into underperforming companies.

As the saying goes, 'if you do the same thing all the time, you get the same result.' This applies to many managers. Too many are one-trick ponies. America is losing its economic hegemony because of it.

But most importantly, it is up to shareholders to step up to the plate and demand changes at their companies. For too long and for a variety of reasons, shareholders have been complicit in allowing management excesses and incompetence by not taking a stand.

"Shareholders have reelected these directors, have approved these pay plans and have been enablers for the addictive behavior of the corporate community," said Nell Minow, editor and co-founder of the Corporate Library in a recent BusinessWeek interview.

Let's hope the global economic meltdown causes shareholders to demand more changes on the part of their companies -- and not leave it to the government.