In the job market, at least, the recession’s pain has been unusually concentrated. ... People who have lost their jobs are struggling terribly to find new ones. Since the downturn began in 2007, companies have been extremely reluctant to hire new workers, and few new companies have started. The economy and the job market are churning very slowly....
Try thinking of it this way: All of the unemployed people in the country are gathered in a huge gymnasium that’s been turned into a job search center. The fact that this recession is the worst in a generation means that there are many, many people in the gym. The fact that the economy is churning so slowly means that there is not much traffic into and out of the gym.
If you’re inside, you will have a hard time getting out. Yet if you’re lucky enough to be outside the gym, you will probably be able to stay there. The consequences of a job loss are terribly high, but — given that the unemployment rate is almost 10 percent — the odds of job loss are surprisingly low.
To the contrary, I think Leonhardt has it almost exactly wrong: not only are people who have lost their jobs are finding it very hard to find new ones, with the attendant terribly high consequences for the individual, their families, and for the economy generally; but also what is starkly different about this recession has been exactly the breadth as well as the depth of job losses.
First, let's look at a historical graph of the US job market.

Viewed on a long-term basis, we can see that since World War 2, the number of American manufacturing jobs has stagnated, while service jobs have grown sixfold!
The total number of manufacturing jobs peaked in 1979 and has been in almost relentless decline ever since. The last decade -- even during the dreadfully lackluster "Bush expansion" -- has been particularly devastating:
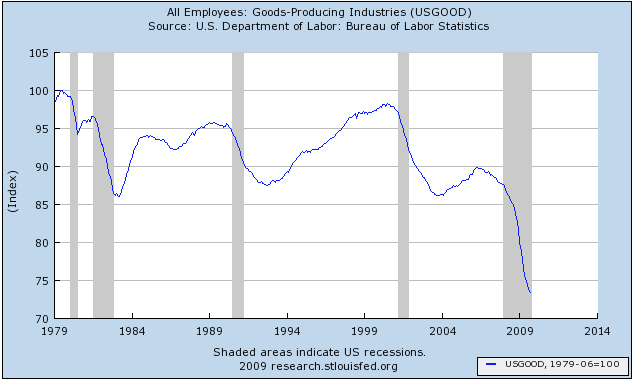
Over 25% of all manufacturing jobs have now been lost. Although I haven't shown an even longer-term graph, in fact there are now fewer manufacturing jobs in the US than there were during the time of "Rosie the Riveter" during World War 2.
Contra Leonhardt, the "surprise" in this recession isn't how concentrated job losses have been, but how general. There truly was a dramatic difference this time. In all prior post-WW2 recessions, it was manufacturing and general goods producing that bore the brunt of job losses. Services were barely touched.
For example, here is the 1981-82 recession (expressed as a change in % of jobs from the manufacturing peak, where peak = 100):
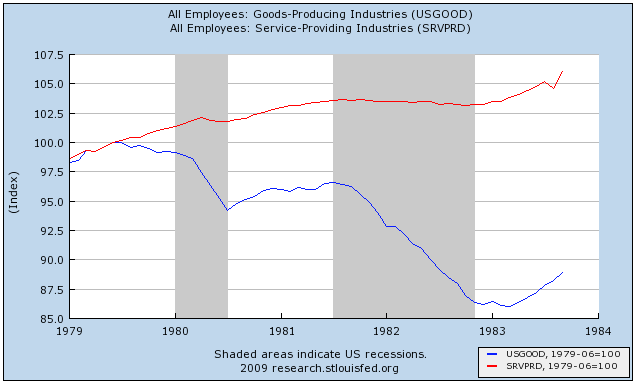
This is the recession that was responsible for 10%+ (U3) unemployment. The vast majority of those job losses were in goods producing jobs (in blue). Note that services (in red), relatively speaking, did not suffer much at all. While almost 15% of manufacturing jobs were lost, only about 1% of service jobs were affected.
The same was true of the 1991 Kuwait War recession and "jobless recovery", and the 2001-2 Tech Bust and 9/11 recession and "jobless recovery".
Not this time. This time, for the first time, services were every bit as hard hit as goods producing jobs. Here's a graph of total goods-producing vs. service jobs for the 1991, 2001, and "Great" recessions and "jobless recoveries":
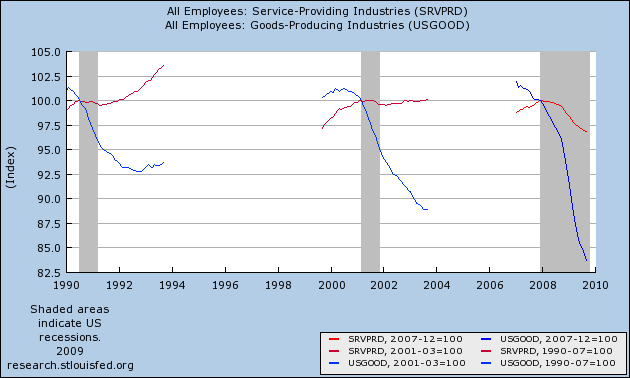
Again, notice that while manufacturing jobs were hard-hit in all recessions, service jobs were barely touched, with losses of only ~1%, in the prior two recessions. Not so this time. Since August 2008, almost 3% of all service jobs have been lost -- and remember that since service jobs are about 6x the number of manufacturing jobs, this is equivalent to 18% of manufacturing jobs being lost -- a staggering amount!
Here's a chart, showing the same in terms of actual numbers of jobs lost: Note how dramatically the data from this recession sticks out.
[*Services measured from 10/80 peak. M = million]
Additionally, it is not so clear that those who haven't lost jobs need to have no fear of losing theirs henceforth.
Lenhardt observes that "if you’re lucky enough to be outside the gym, you will probably be able to stay there." True enough, but the chances of losing one's job even now are much more than trivial. Even if we accept that we are already out of the Recession in GDP terms, and even if we accept for purposes of this argument that the economy may yet start to actually add jobs before next year, at minimum there will probably be 250,000-750,000 more net job losses first. During that same period of time, as we know form weekly new unemployment claims, about 500,000-550,000 jobs will be lost per week. That's a total of something like 6 million (525,000 x 13 weeks) newly unemployed between now and the end of the year, counterbalanced by 5.5 million new jobs, for a net loss economy-wide of 500,000 by year-end. Since there are about 120 million employed, 6 million pink slips amounts to 5% of the workforce (note this % is for losses only, and does not count new jobs added). Those are non-trivial odds of currently employed people entering Leonhardt's "gymansium."
Finally, some notes in response to last Friday's abysmal jobs report. First of all, did I mention it was abysmal? It was, and for all the reasons spelled out by Invictus and others. Like Bonddad, however, I am impressed by the broad array of signs that indicate we have at least taken the first halting steps in economic expansion. That both ISM manufacturing and non-manufacturing surveys both show expansion for the first time since the recession began is particularly noteworthy, in addition to two months' straight of increased industrial production. That makes it all the more stunning that an expanding economy could nevertheless shed a quarter million jobs.
That being said, a graph breaking down the number of unemployed by weeks out of work, shows the exact same pattern as for all prior recessions and recoveries:
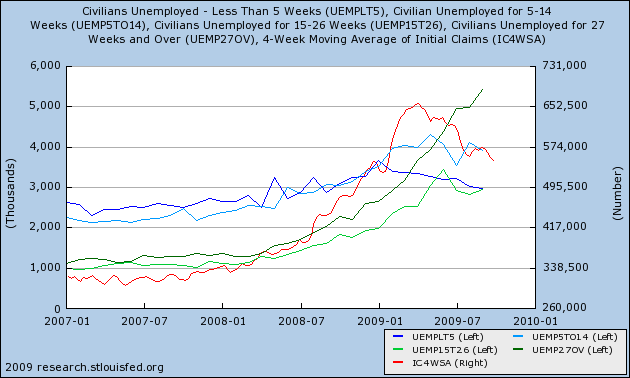
The graph above shows that initial jobless claims (red), unemployment for under 5 weeks (blue) and unemployment for 5-14 weeks (light green) have all likely peaked and are not "false dawns." Longer term unemployment continues to grow.
To use an analogy, suppose there has been a bad traffic accident on an expressway during rush hour. Several lanes of traffic are closed, but then as the accident is cleared away, lanes open up. Traffic at fist is at a near dead halt, and more and more traffic gets stuck in the rear of the jam. As lanes are cleared, more traffic leaves the front of the traffic jam, but more still continues to be added to the rear, increasing the total number of cars at a standstill. Eventually more traffic leaves than enters before the jam dissipates.
The above graph shows that the front of the traffic jam is able to leave at an increasing rate, but there is still on net more traffic entering the rear of the jam.
So, why the huge continuing job losses? Here's my best take. In the first place, 61,000 of the jobs lost in September were in government. While Invictus correctly points out that they consume just as much as anybody else, the fact is that job losses in government have historically come very late into recessions, or even months into the recoveries thereafter (as in, e.g., the three previous recessions.
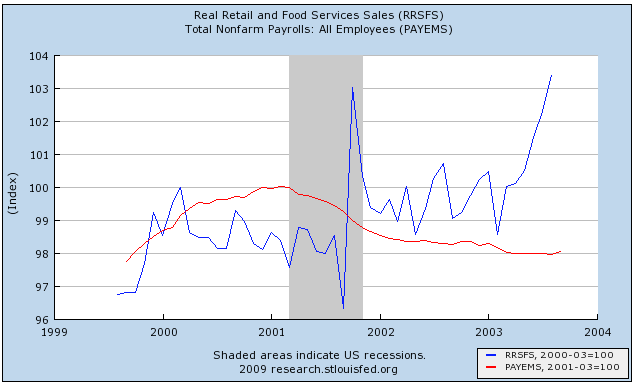
More disturbing is the 38,000 loss of retail jobs. As I have previously noted, most bloggers have it exactly backwards. Jobs don't lead consumption; historically consumption leads jobs. In the mild 2001 recession, consumption (real retail sales, in blue) barely flinched, and picked up soon enough that jobs (in red) were not lost beyond the same percentage as retail sales had declined:
In the "Great Recession," real retail sales have declined 10%, but service jobs have only declined about 5%:
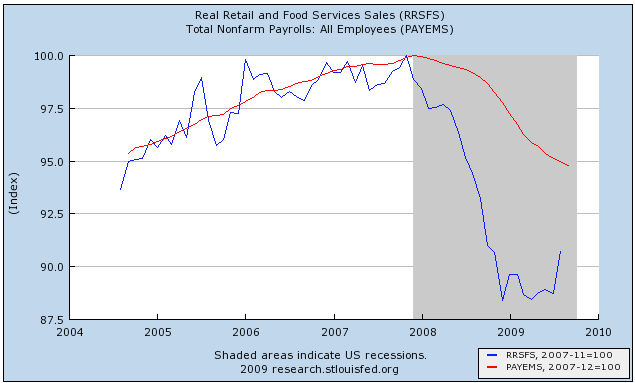
While employers have been quick to cut jobs and slow to rehire, the fact is, do they really need 95% of the previous workforce to sell 90% of the previous number of goods? No, and eventually if sales don't pick up, that is what we might get. (Note per my recent analysis of jobs, I do believe that sales will in fact pick up).
To put this in final perspective, here is a graph I prepared in connection with a previous post about Okun's law, to the effect that it requires 2% year over year growth in GDP to create a single new American job:
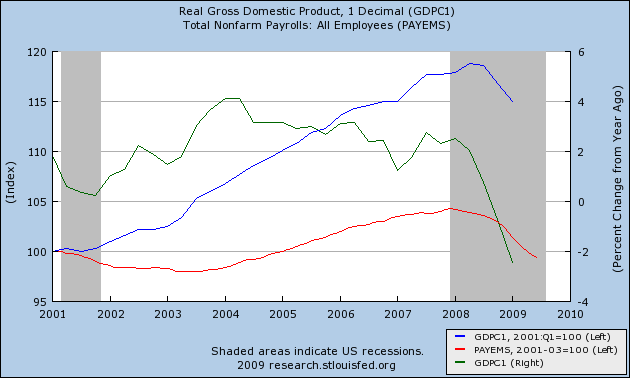
Note that when GDP briefly hit 2% YoY in mid-2002, there was a brief gain in payrolls, as well as the more sustained growth beginning in 2003. To get to 2% GDP growth for calendar year 2009, we need about 2.3% growth in each of the third and fourth quarters. Most analysts believe we will get that growth, at least in the third quarter. As to the fourth quarter, we will see.