Wednesday, November 7, 2007

Today's Markets


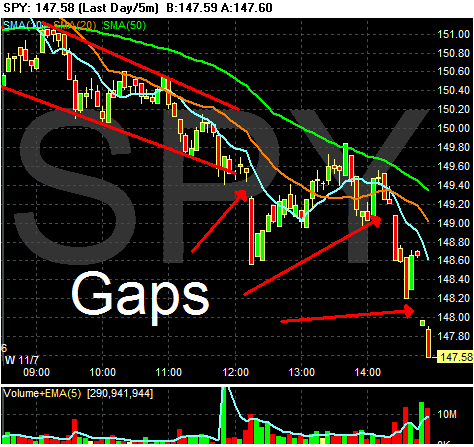
This is a very ugly daily chart.

1.) The overall direction is down -- big time down.

2.) There are three downward gaps that occurred on heavy volume. That's not good.

3.) The market closed at the low point, on heavy volume just after the third gap down. That's a triple whammy of bad events. Traders didn't want to hold positions overnight because they were concerned something would happen between now and the open that would lower stock prices.

Why are gaps down bad? To Quote Bulkowski from Encyclopedia of Chart Patterns, "...in both cases [of upward and lower gaps] some type of exuberance is driving the stock to create a gap (page 241)." In other words, there is a strong emotional reason for the change. It's safe to say that a downward gap is a sign of extreme concern. When there are three gaps on a single day, it's s sign of really extreme concern.
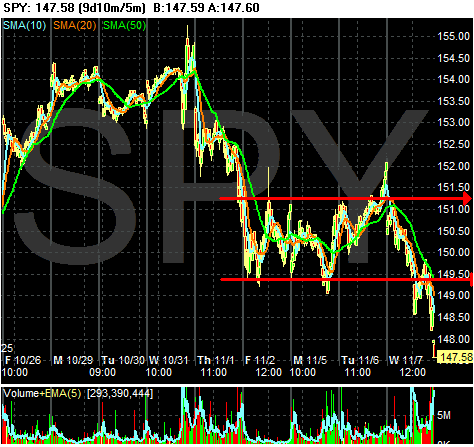


The 9-day chart shows the SPYs were in a three and a half day consolidation/trading range. But they broke through support on heavy volume at the end of trading. Breakdowns indicate a change in sentiment. When they occur on heavy volume sentiment it's that much more intense.
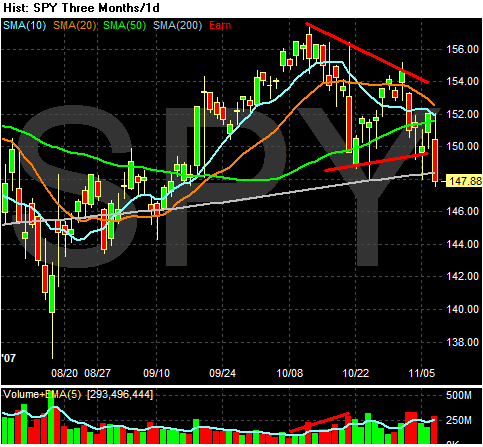


The SPYs daily chart shows we have broken through support and the 200 day SMA on heavy volume. Again a triple whammy.
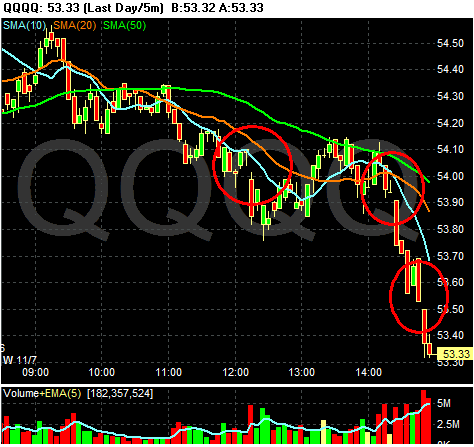


The one day QQQ chart also shows three downward gaps that occurred on heavy volume. Also notive the index sold-off at the end of trading on heavy volume.
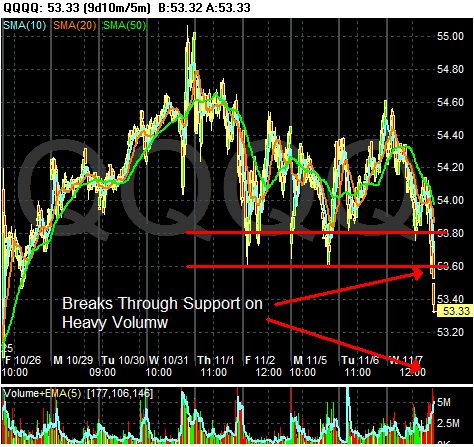


The 10-day QQQQ chart shows they too were in the middle of a consolidation pattern, but they also broke through support on heavy volume at the close of the market. This is not good.
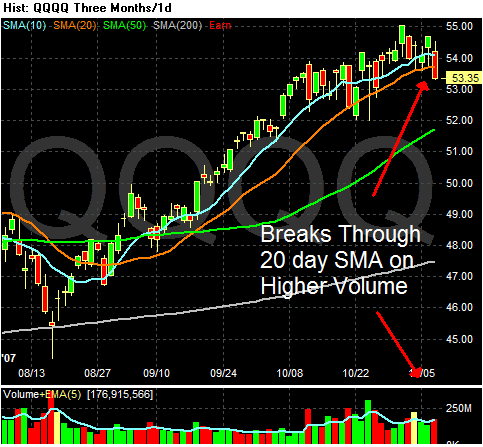


The daily QQQQ chart shows the index broke though the support of the 10 and 20 day SMA on heavy volume. That's very bad.

In addition, consider these two charts from stockcharts.com.

NASDAQ Breadth
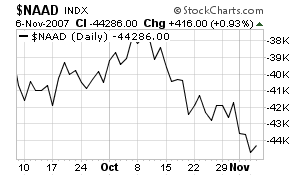


NASDAQ new highs/new lows
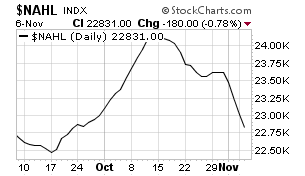


Both of these charts tell us that fewer and fewer NASDAQ stocks were responsible for the index's gains. That indicates there was a lack of breadth across a wide swath of stocks.

Short version -- this day was terrible. It did a lot of technical damage.

Read This Now

Afraid to Trade has a great post on moving averages. They are among my favorite indicators and this post partially explains why.

The Words "Crisis" and "Dollar" Appear in the Same Sentence

From Marketbeat:

“We’re in the midst of a dollar crisis here and the market is reflecting on the high cost of oil and the falling dollar and soaring gold prices,” says Peter Cardillo, chief market strategist at Avalon Partners. “The good economic news is going to be overshadowed by the dollar crisis that we’re now in.”


The reason?

The dollar fell the most since September against the currencies of its six biggest trading partners after Chinese officials signaled plans to diversify the nation's $1.43 trillion of foreign exchange reserves.


The standard method of public communication from Asian central banks is to make a public statement, deny it is official policy, but then act as is it were official policy. Here is a link to the Treasury International Capital Page that shows Asian central banks haven't been buying Treasuries that much over the last year.


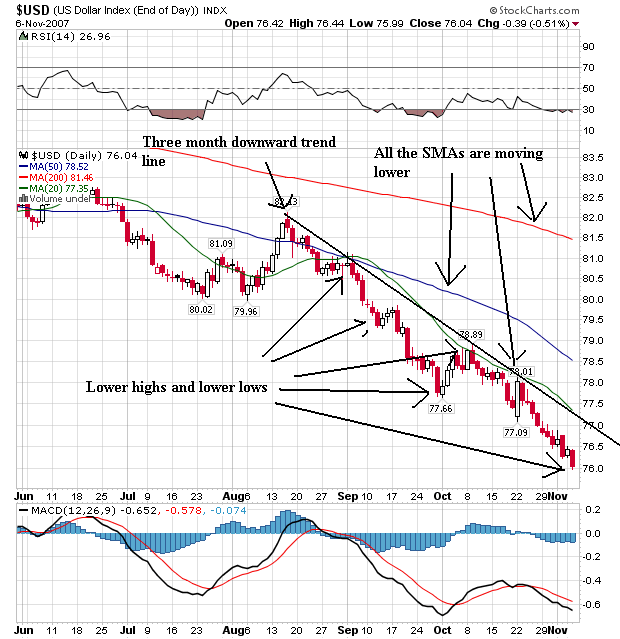
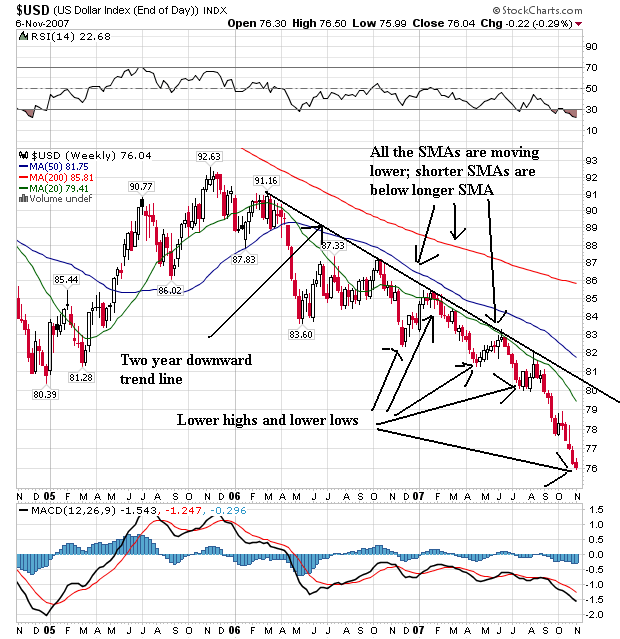
The dollar's daily and weekly charts are both extremely bearish. Notice

1.) There are strong downward trends in place.

2.) All of the simple moving averages (SMAs are moving lower).

3.) The short SMAs are lower than the longer SMAs.

4.) Prices are below the SMAs, indicating the SMAs will be moving lower.

The bottom line is these are both extremely bearish charts.

What Inflation?

From CNBC

Food maker Sara Lee said Wednesday its fiscal first-quarter profit dropped 40 percent due to higher commodity costs and an increase in marketing and advertising spending.

For the quarter ending Sept. 29, net income fell to $200 million, or 28 cents per share, from $333 million, or 44 cents per share in the prior year quarter.

Analysts polled by Thomson Financial expected earnings per share of 27 cents.

Sara Lee said its profit was hurt by "a very challenging input cost environment" as prices rose for commodities such as wheat, poultry, pork and green coffee.


There is no need to look any further, because we all know that those silly and meaningless price fluctuations from agricultural prices are unimportant and should play no role in interest rate policy. In fact, just ignore the following chart because it has no effect on anything.


For those of you who looked, notice the Goldman Sachs agricultural price commodity index has risen almost 90% in three years. But remember -- it's not part of core inflation, so it doesn't matter....unless you're a Sara Lee stockholder.

Can anyone at the Federal Reserve read a damn price chart?

Gas Prices and Holiday Spending

From the WSJ:

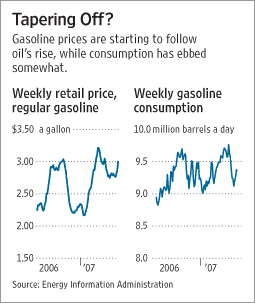
Gasoline has trailed oil's rise to nearly $100 a barrel, but fuel prices now look poised to take off.

Oil climbed $2.72 to $96.70 a barrel in New York Mercantile Exchange trading, bringing it closer to an inflation-adjusted high of $101.70 reached in April 1980. The sharp rise and an extended period of high prices has sent heating oil to new highs. (Please see related article.)

Gasoline is now expected to follow, potentially taking money out of the pockets of consumers at a time of weakening growth in consumer spending.

The average price of regular gasoline was $3.02 a gallon, according to AAA, formerly the American Automobile Association. That was up from $2.77 last month and from $2.20 a gallon a year ago. "Unfortunately between now and the end of the year gasoline prices will continue to rise if oil stays above $95 a barrel, and certainly if it goes above $100 a barrel," says Geoff Sundstrom, spokesman for the AAA.


The article also has the following chart:


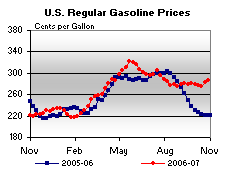
Here's another chart of gasoline prices from This Week in Petroleum.


Notice that gas prices are usually seasonal, rising in the summer as demand picks up and dropping in the fall as demand falls. However, thanks to record high oil prices, that pattern isn't occurring this year (at least so far). As a result:

Anxious retailers are already clamoring to outdo each other with bigger and better Black Friday-like deals, threatening to make Black Friday itself a non-event this year.

"Black Friday this year may show some signs of vulnerability if retailers keep promoting to the extent that they already are," said Marshal Cohen, chief retail industry analyst with market research firm NPD Group.

Wal-Mart (Charts, Fortune 500), the world's largest retailer, isn't waiting to jumpstart its holiday sales.

Wal-Mart already treated its shoppers to an appetizer of its holiday blockbuster deals this past weekend, which included a 14-inch Acer LCD-screen laptop for $348 and a Sanyo 50-inch plasma HDTV for $998.

.....

Toys "R" Us shipped its annual holiday discount catalog late last month. Wal-Mart's rival Target (Charts, Fortune 500) rolled out it's holiday ad insert this past weekend.

Department store chain J.C. Penney (Charts, Fortune 500) currently is touting "The biggest sales of them all!" at its stores, offering its shoppers 20 to 60 percent off on clothes and home-related goods.

Also this week, Penney's rival Kohl's (Charts, Fortune 500) has cut prices by as much as 40 percent on sweaters, 50 percent on footwear and 60 percent on jewelry.

Among specialty sellers, both American Eagle Outfitters and Aeropostale (Charts) set 50 to 60 percent discounts on jeans and sweatshirts.


A few points need mentioning.

1.) Oil prices are extremely volatile right now. One of the primary reasons for oil's increase is the situation along Northern Iraq with Turkey. If this situation resolves peaceably then a large stimulus for oil's increase will be gone and traders will probably take profits. In other words, oil's price increase is extremely fluid.

2.) Counting out the US consumer is a very bad idea. Americans love to shop and usually find a way to do so, regardless of how. So don't bet against them yet.

3.) The housing market has been in turmoil for about a year now. At this time last year, we were getting the first signs of problems in the mortgage market. But the story really wasn't that important than. Now we've had a year of dropping home prices, huge write downs at various Wall Street Firms, a big summer stock market correction caused by mortgage related problems and two interest rate cuts. Another way to put this is the housing market story has been in the news prominently for about a year and none of the news has been good. This has had a definite impact on consumer sentiment, which is at it's lowest level since May 2006. So the overall consumer sentiment environment has definitely changed for the worse over the last year.

Retailers are concerned enough to start lowering prices and offering incentives. And traders are selling department store shares, indicating they are concerned enough to drop retail positions.

It's shaping up to be a very difficult Christmas shopping season.

Tuesday, November 6, 2007

A Look At Oil, the Energy ETF and It's Largest Holdings

Energy is the best performing sector of the last year and since the beginning of the year. According to stockcharts.com perf function, the energy ETF is up 37.32% over the last year and 29.71 year to date (as of Sunday). So let's take a look at a chart of oil, the XLE ETF, and some of the largest holdings in the ETF.


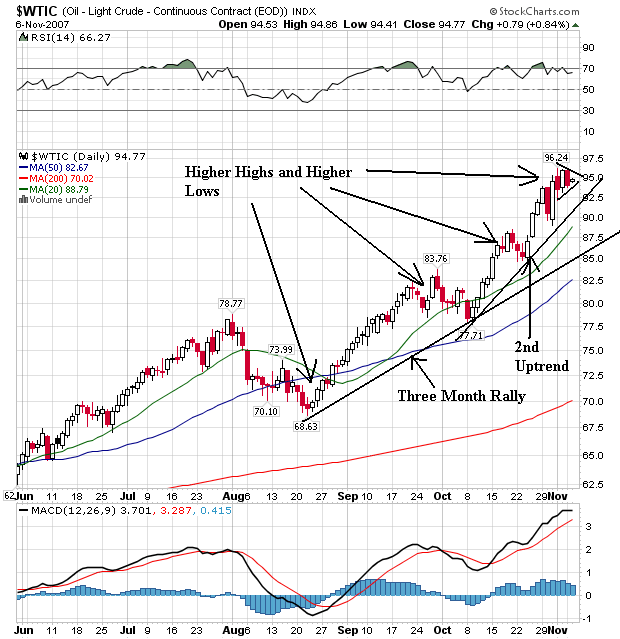
Oil's daily chart is strong. It is in the middle of a three month rally which has a consistent pattern of higher highs and lower lows. Prices have continually moved through previous levels. There are two trend lines in place. All of the simple moving averages (SMAs) are moving higher, the shorter SMAs are above the longer SMAs and prices are above all the SMAs. This is a great example of a bull chart.


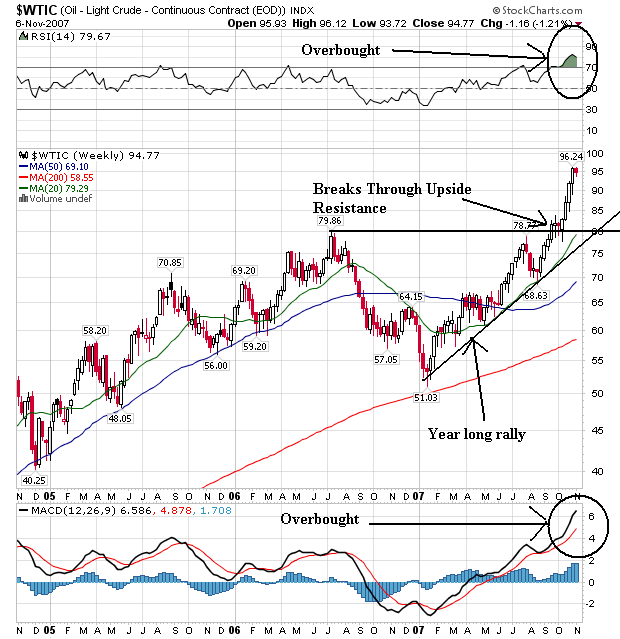
The weekly chart shows an uptrend that started at the beginning of the year. It also shows prices moved through the July 2006 level, consolidated just above that level and then continued higher. The main drawback to this chart is the overbought reading on the RSI and MACD. However, these do not completely determine market direction; these readings could stay pegged for some time.

So -- the underlying commodity of this sector is in a very clear bull market. Let's see what the ETF looks like.


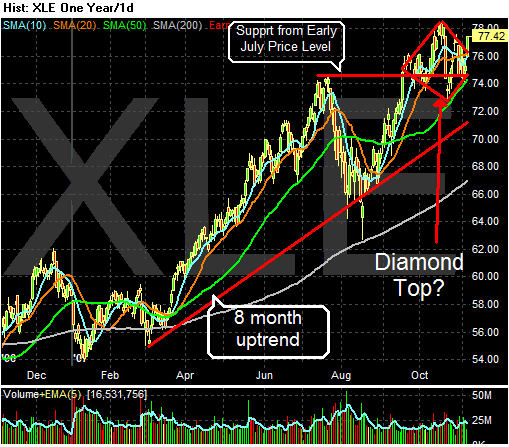
The ETF is in the middle of an 8-month uptrend. Current prices are receiving strong support from the mid-July high. A diamond top may be forming, but prices also broke out from that pattern yesterday thanks to oil's record close. The 50 and 200 SMAs are both moving higher, but the shorter SMAs are a bit bunched up indicating a lack of direction. Yesterday's price break out is a good start, but prices need to move above the mid-October high to indicate a new uptrend is in place.

According to Yahoo finance, the largest stocks in the sector are Exxon, Chevron, Schlumberger, Occidental Petroleum and Conoco Phillips. We'll take them in order of largest percentage of the index to the smallest.


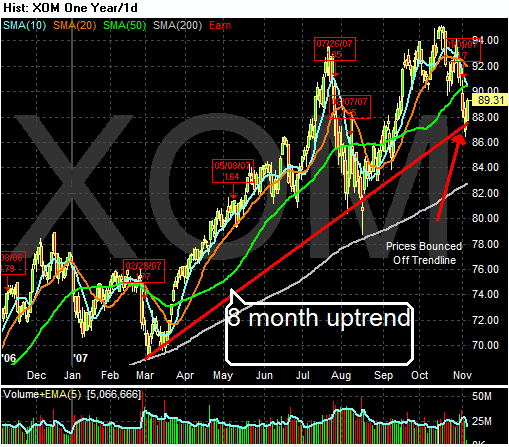
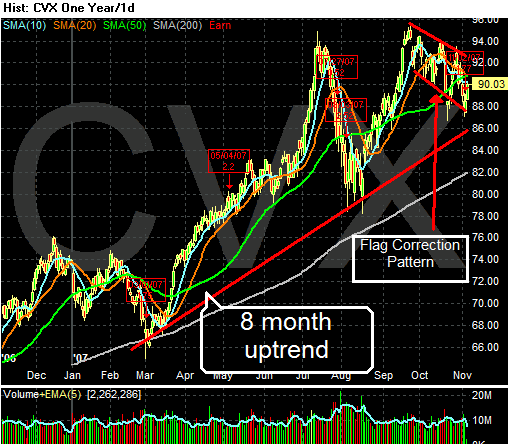
Exxon is in the middle of an 8-month long rally. It has bounced off the trend line twice. Yesterday's bounce printed a very strong bar. The bearish side of the chart notices the 10 and 20 day SMA moving lower with the 10 day about to cross the 50 day SMA. However, the strength of yesterday's bar along with the oil market's rally provide a strong reason for this bounce to continue.


Chevron is in the middle of an 8 month rally, but is also in the middle of a month-and-a-half long flag correction. The shorter SMAs are headed lower and the chart may have printed a double top with the first top in early July and the second in late September. However, the stock hasn't moved out of the flag pattern, indicating it may simply be going through a standard correction before it moves higher.


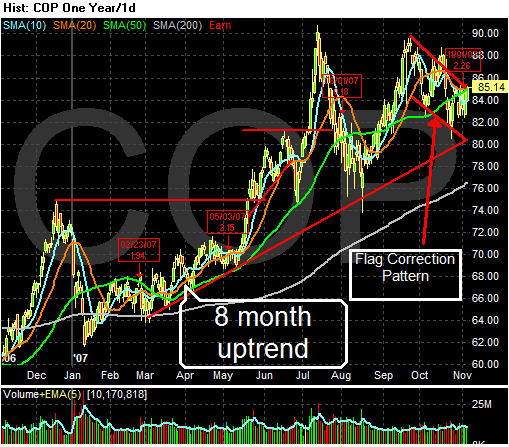
Conoco Phillips chart mirrors Chevron's in many ways. The main difference is prices are at the top of its respective flag pattern. Should they move through resistance this stock could be looking at a 3-5 point move.


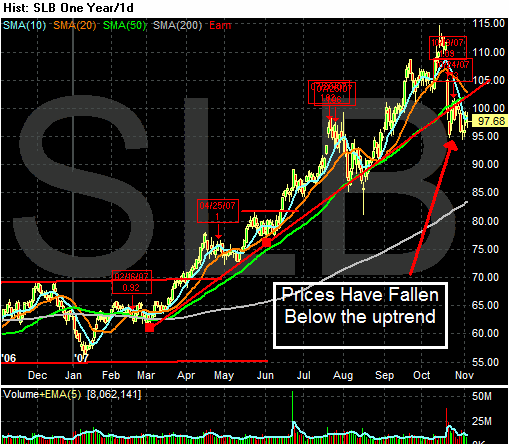
Schlumberger is the only bad stock in the bunch. It has broken through its 8 month long uptrend indicating a clear change of direction. Although prices are consolidating right below the trend line, the shorter term SMAs are both headed lower indicating the short-term trend is down.


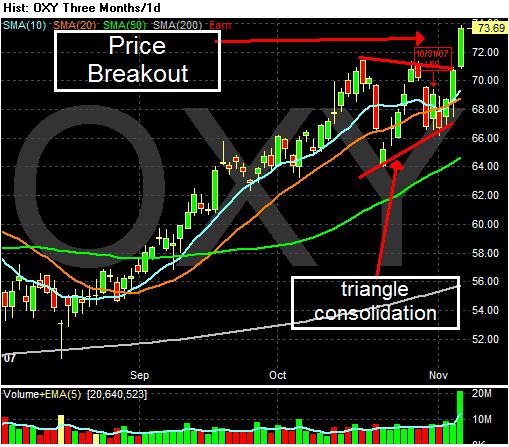
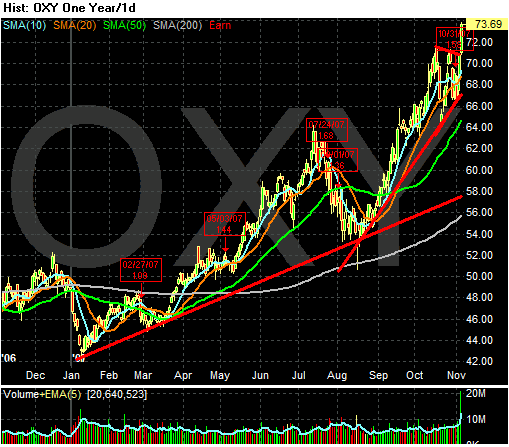
Occidental Petroleum printed a month long triangle consolidation and is now breaking out of that pattern on strong volume. Here is the year long chart


Which shows a definite uptrend in place.

Retail Is "Just Wrong"

From CNBC:

With retail stocks down 11% year to date, you would think some would be out looking to call a bottom, but bearishness remains very high among retail analysts. Morgan Stanley very typical of that mood this morning, was out with a long note on retailers called "Not Too Hot, Not Too Cold, Just Wrong."


Here's a chart from CBS.Marketwatch of the S&P retail sector:


When sectors break through three year support, you know there's trouble out there.

Today's Markets


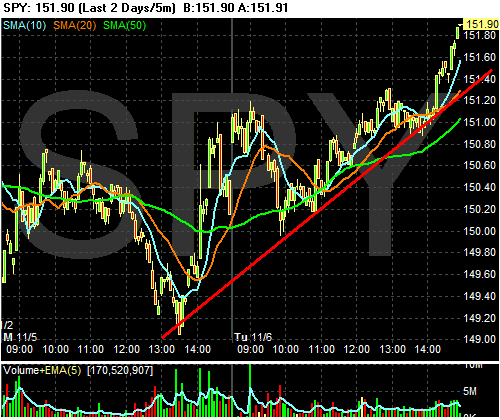
As the two day chart shows, the SPYs are rallying upwards. The markets got a jolt yesterday around the 149 level with heavy volume buying. My guess is 149 was an important level for some computer programs.


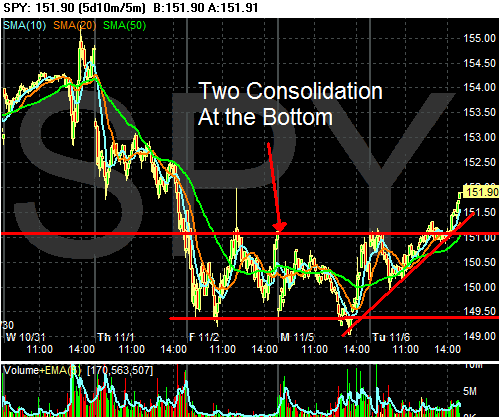
The 5-day chart shows a two day consolidation between the 149.40 and about 151. We also see the market's broke out of this range at 2PM CST today on good volume.


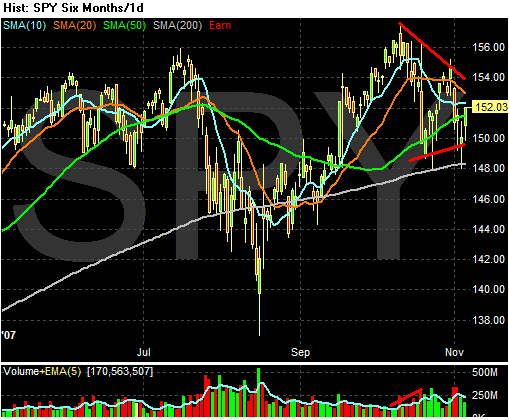
The six month daily chart shows some interesting points. First, we have a possible double top, with the first top occurring in early July and the second occurring in early October. These levels are near record highs for the S&P which have provided top side resistance for the last four months. As I mentioned in this post over the weekend it's looking like that area will provide stiff upside resistance.

In addition, we may have a triangle consolidation pattern forming over the last few weeks. This would make sense given the overall uncertainty of the financial markets right now. While the last Fed statement alluded they would not lower interest rates again, the recent news from the financial sector may still fuel the bull's hopes. This would give the market some upside pressure. However, record high oil prices along with concern about Christmas will give the bears ample ammunition. In other words, there are still decent arguments from both sides of the street, putting the market squarely in a trading/consolidation range.


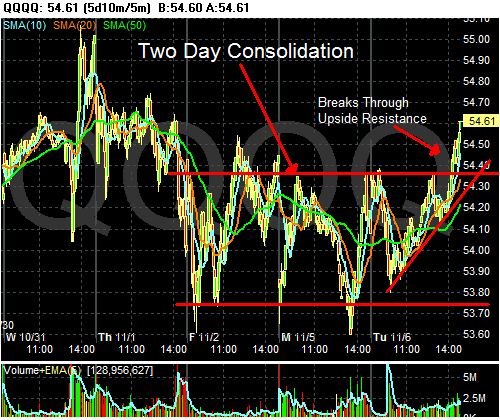
Like the SPYs, the QQQQs show a two day consolidation pattern and a break through upside resistance in today's session.


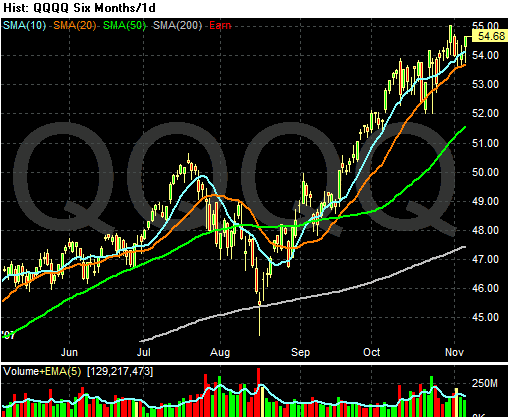
However, the QQQQs daily chart shows a rally still in place. The simple moving averages (SMAs) are all heading higher, the shorter SMAs are above the longer SMAs and prices are still above all the SMAs.
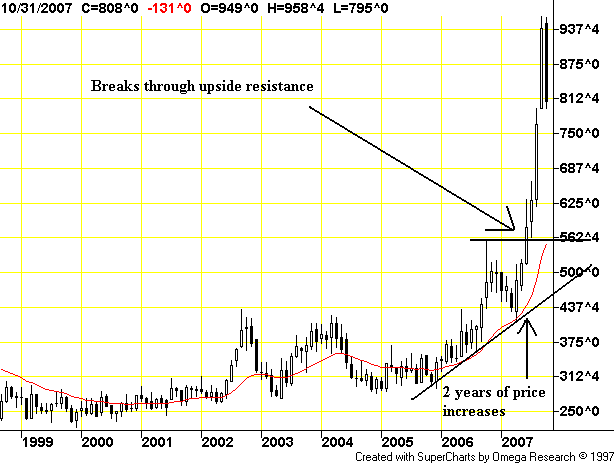
Aren't You Glad Food and Energy Costs Aren't Important?

From CNBC:

Some retailers have already lowered their October forecast. Target Corp. reduced same-store sales guidance mid-month, for the second month in a row, citing "greater-than-normal daily volatility and continued disappointing sales results."

......

Meanwhile, specialty retailers are facing declining mall traffic as consumers curb discretionary spending due to high gas and food prices and other economic concerns.

.....

"Mall traffic continues to be down, making it even more important to convert the customers who do walk through the doors," wrote Buckingham Research Group analyst John Zolidis in a client note on Monday.


This chart from This Week in Petroleum doesn't mean anything and has no effect on anything.

What Inflation?

From the WSJ:

With the price of crude oil hovering above $90 a barrel, airlines are accelerating efforts to raise ticket prices to help offset the higher cost of fuel.

.....

AMR Corp.'s American Airlines, the world's largest carrier by traffic, succeeded in pushing through an unusually large fare increase announced Thursday. That increase of $20 on round-trip domestic fares was double the typical boosts made by American and many of its competitors.

Those airlines matched American's increase over the weekend.

.....

"Given surging crude prices, fare increases are occurring at a stepped up pace," said J.P. Morgan airline analyst Jamie Baker, who said he has also witnessed stepped up efforts from smaller airlines, including AirTran Holdings Inc. and JetBlue Airways Corp. in the past week.

.....

The price of refined jet fuel has risen more than 40% since January. That has put increasing pressure on an airline industry that just returned to profitability last year. Airlines have slashed their costs sufficiently to remain profitable this year. They have also curbed growth, which has helped the industry boost fares more successfully.


Don't look any further at this post, because there isn't a chart of oil that shows a near record price. In fact -- the chart that follows (which isn't important because it's not a core price) won't show you anything you need to know. Just go to another website, OK?


Great -- now you've looked at oil prices and have seen they are rising fast. But they're not part of core inflation, so just try to forget about this information, OK?

Citigroup's Problems Continue; Start to Infect the Whole Sector

From the WSJ:

One day after the departure of Chief Executive Charles Prince, Citigroup Inc. officials said it will take the bank until the middle of next year to clean up its problems caused by credit-market turmoil.


Let's stop right there are acknowledge the obvious. Citigroup is publicly stating the turmoil in the financial sector is not a one-time event, but instead the beginning of a rather long process that will take at least until the end of June 2008 -- 8 months from now. That makes a hell of a lot more sense given that no one really knows how much further damage is possible. Anyone who says this is a one time event or this won't cause damage beyond the end of the year is lying through their teeth.

Citigroup's new woes underscored for many investors that the fallout from credit-market turmoil will likely continue for longer than many expected. Counting Citigroup's potential new losses, banks and investment houses will have racked up combined losses of more than $30 billion because of mortgage- and debt-market problems [in the latest quarter]. Many worry that Citigroup's predicament is a signal that more losses could be in store for other financial players.


The third quarter has demonstrated two very important points. First, the problem is widespread. I can't think of a major financial player who hasn't announced some type of portfolio writedown this quarter. Secondly, the problem is big. So far this quarter we've seen $30 billion in writedowns. That's a significant amount of capital that is vanishing into thin air. And Citi's tacit acknowledgment that further writedowns are possible indicates this won't be the last time we see the phrase "writedown" in a financial company's earnings release.

The magnitude of Citi's writedowns are starting to negatively impact trader's and analyst's perception of the sector:

For followers of banking stocks, the scary part isn't that Citigroup (C) might write down as much as $11 billion in subprime mortgage losses this quarter.

The scary part is that Citi and other leading banks might still be lowballing their losses in hopes that things won't get any worse.

Citi on Sunday said it expects to write down $8 billion to $11 billion before taxes for its $55 billion of exposure to U.S. subprime mortgages.

Last quarter, the banking giant swallowed $6.5 billion related to subprime mortgages, loan losses and other debt. Those losses trimmed its third-quarter profit by 3 cents a share.

Sunday's announcement came less than a month after Citigroup told investors it had a "good, sustainable strategic plan" for managing the subprime mess.

Boasts like that might have calmed some nerves during the early stages of the subprime crisis. But with the bad news continuing to repeat itself, Wall Street is having a harder time seeing the glass as half full.

Skepticism is so high that many analysts are already questioning whether Citigroup went far enough with its latest write-down.

"Maybe they could have taken off $10 billion to $15 billion," said Kris Niswander, senior banking analyst at SNL Financial. "Whether or not that was aggressive enough is yet to be seen."


(Back to the WSJ article)

Chief Financial Officer Gary Crittenden, on a conference call with analysts yesterday, acknowledged that the $8 billion to $11 billion in losses flagged by the bank are an estimate of write-downs that may be needed. The bank "can't give any assurance" that the loss won't grow as the quarter progresses, he added.


Further writedowns should surprise no one at this point given the breadth and depth of the problems we've seen so far. But public acknowledgment of the problem is important.

Citigroup is getting hammered right now because it is one of the largest financial firms in the world. But it is hardly alone right now -- every major financial player is going though similar problems. Note the following action on Monday:

Fitch Ratings on Monday called into question the capital reserves at financial guarantors such as Ambac (ABK - Cramer's Take - Stockpickr - Rating), MBIA (MBI - Cramer's Take - Stockpickr - Rating) and Security Capital Assurance (SCA - Cramer's Take - Stockpickr - Rating), along with closely held Financial Guaranty Insurance and CIFG Guaranty.

Fitch's review is due to take four to six weeks. If it cascades into full blown ratings downgrades, it could create another wave of forced selling in the credit markets -- this time in the $14 trillion municipal bond market.

"It's starting to feel a lot like summer," says Sid Bakst, senior portfolio manager at Weiss Peck & Greer Investments, and he's not referring to the weather.


Short version: this ain't over by a long shot.

Monday, November 5, 2007

Deparment Stores Have Been Naughty

With the Christmas season fast approaching, it's time to start looking at retailers. Traders aren't very happy about big department store prospects.

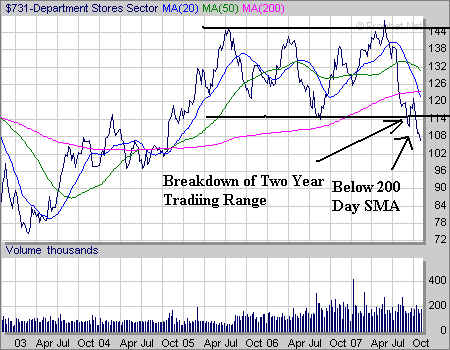
First, here is a chart from Prophet.net of the department store sector.


There are several significant points to make about this 5-year chart.

1.) Most importantly, the index broke a two year long trading range.

2.) The index is trading below all of its SMAs.

3.) The index is below the 200 day SMA, indicating bear market territory.

4.) The 20 and 50 day SMAs are both headed lower.

All in all, this chart says "sell me....now."

According to Yahoo finance the five largest stocks in this index by market cap are Sears Holdings, Kohls, Macy's TJ Maxx and J.C. Penney. Let's see how those individual charts look.


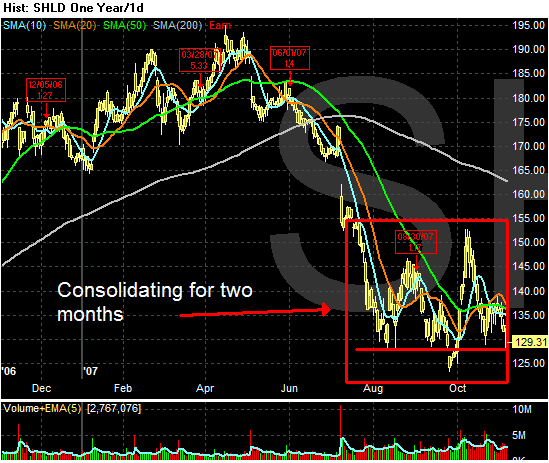
Sears is below the 200 day SMA. It dropped hard with the summer's sell-off and has yet to rally convincingly from that sell-off. Right now it's consolidating. The 10, 20 and 50 day SMAs are all bunched together indicating there is no clear short-term trend in place. But a move below 125 would indicate further selling is underway.


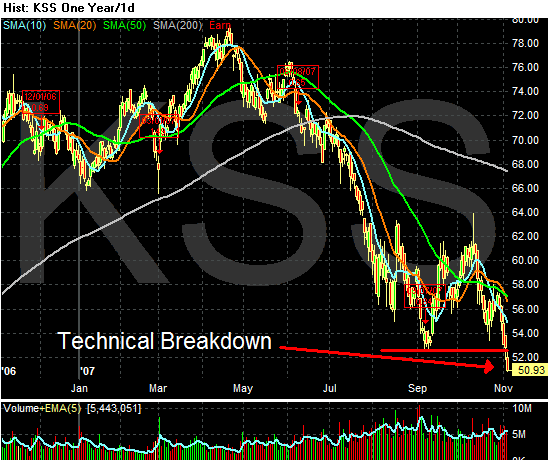
Like Sears, Kohls sold-off during the summer. But this stock has fallen through technical support on strong volume. In addition, the 10, 20 and 50 day SMAs are all heading lower indicating the short-term trend is down. Finally, the stock is convincingly below the 200 day SMA, indicating its already in bear market territory.


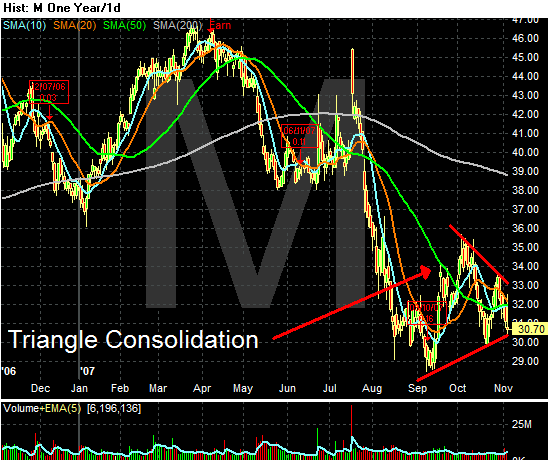
Macy's chart resembles Sear's. It sold-off in the summer, but is currently consolidating in a triangle consolidation pattern. Finally, it too is in bear market territory.


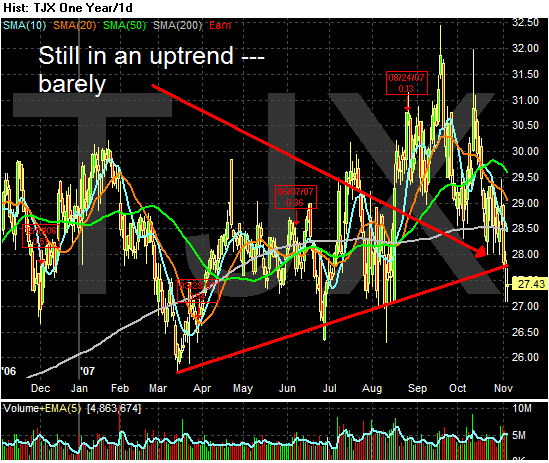
TJ Max is hugging its upward trend line like nobody's business. Today it moved though support. In addition, the stock has moved below the 200 day SMA, but it has been flirting with this line since April. In addition, the 10, 20 and 50 day SMAs are all heading lower. This chart stinks -- and it is the best one of the lot.


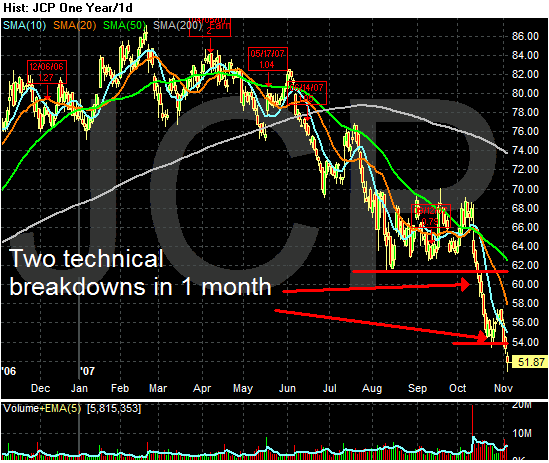
JC Penney is below the 200 day SMA, the 10, 20 and 50 day SMAs are all headed lower (as is the 200 day SMA), the shorter SMAs are below the longer SMAs and prices are below all the SMAs. This chart says sell me -- NOW.

It looks like the big department stores were definitely naughty this year.

Like Lemmings Off a Cliff....

From Bloomberg (note these two paragraphs are in the same story...)

U.S. stocks pared losses as CNBC reported that Goldman Sachs Group Inc. denied a rumor of a writedown.

.....

Lehman Brothers Holdings Inc. said today it expects banks to suffer $200 billion to $250 billion of combined losses on mortgage portfolios over the next five years and $50 billion next year. Fitch Ratings downgraded Citigroup's debt to AA, with a negative outlook.


I'm not saying that I have any knowledge that Goldman will write anything down. But everybody has written something down over the last month. This reminds me of Countrywide saying its latest results were the low point of the cycle on the same say they announced massive write downs, job cuts, an increasing loan loss reserve and a loss for the quarter. Of course, Countrywide rallied that day......

Today's Markets


The markets opened lower and then traded in an inverted saucer pattern until they got to about 149. Then the volume really picked up which is usually an indication of serious program trading activity. The markets couldn't hold the upward momentum and sold-off a few minutes before the close.


The 5-day chart shows consolidation over the last few days with today's late action breaking the downward trendline.


The daily chart shows the price action below the 10, 20 and 50 day SMAs along with some heavy volume over the last few trading sessions. As the VIX chart below and long candles of the last few days show, volatility has been creeping up over the last few sessions.


The QQQQs have more support for their current market position. That's the good news.


The bad news is although the QQQQs are holding to their short-term averages....


The NASDAQ advance/decline line is breaking down


As is the QQQQs new highs/new lows line.

The market internals for the NASDAQ -- which is the market's great hope right now -- are not looking good at all. Fewer and fewer stocks are contributing to the rally.

Financials Look Terrible


The financial sector looks terrible. Note the following very bearish conditions on the chart.

1.) Prices are below the 200 day SMA and have been there awhile.

2.) The shorter SMAs are below the longer SMAs -- another very bearish signal.

3.) Prices are below the SMAs, which will pull them lower over the short term as well.

4.) In early October the index rallied to the 200 day SMA but couldn't get higher. That means there wasn't enough enthusiasm for the sector to take it out of bear market territory.

This is a chart that should concern everybody.

Sunday, November 4, 2007

What Inflation?

According to the Federal Reserve, the only inflation rate that matters is "core" inflation. This is the inflation rate less food and energy prices. The underlying reasoning of this position is because commodities' prices seasonally fluctuate, their impact isn't that pronounced unless the price increase bleed through to core inflation -- inflation less food and energy.

In a world where commodities' prices are seasonal -- that is they rise and fall in predictable patterns -- this way of looking at inflation makes sense. But in a word where commodity prices continually increase on a multi-year basis, this policy of focusing solely on core inflation ranks up there with "we can win a land war in Asia" as one of the dumbest ideas around.

As the following smattering of news stories indicate, commodity price increases are not an ivory tower theoretical issue; they are starting to hit businesses in practical, day-to-day ways.

From the BLS' latest inflation report:

The index for energy, which advanced at annual rates of 22.9 and 32.9 percent in the first two quarters, declined at a 14.8 percent rate in the third quarter of 2007. Thus far this year, energy costs have risen at an 11.7 percent SAAR after increasing 2.9 percent in all of 2006. In the first nine months of 2007, petroleum-based energy costs (energy commodities) advanced at a 20.6 percent rate and charges for energy services (gas and electricity) increased at a 1.3 percent rate. The food index rose at a 5.7 percent SAAR in the first nine months of 2007 after advancing 2.1 percent in all of 2006. Grocery store food prices increased at a 6.7 percent annual rate in the first nine months of 2007, reflecting acceleration over the last year in each of the six major groups. These increases ranged from annual rates of 4.0 percent in the index for other food at home to 17.7 percent in the index for dairy products.


From Forbes:

Oil prices affect every corner of the market, even the most quotidian ones. And with oil at $96 a barrel one unobtrusive sector suffering is containers and packaging.

Packagers are heavy consumers of petrochemicals, which are basically plastic. So the higher the oil price, the higher plastic resin prices are. So packagers that use plastic resin have been hit hard.


From the Motley Fool:

But in Kraft's case, the top-line "momentum" didn't trickle down to the bottom line. Earnings per share on a reported basis were $0.38, a decline of 15.6% from the prior year. Excluding unusual items, the picture looks somewhat better -- $0.44, or a decline of 4.3%. The one scrap of good news in these lower earnings: The company did beat consensus analyst estimates by $0.02 per share, which propelled the stock higher shortly after the release.

The earnings culprit is "higher input costs," meaning that dairy raw material costs rose more quickly than the company could hike its prices to compensate. For example, raw material costs to make cheese, a key product for Kraft, have skyrocketed 40%.


From CNBC:

Consumer products maker Procter & Gamble Co. said Tuesday its first-quarter profit rose 14 percent, but said rising commodity, energy and product investment costs will hurt its second-quarter margins.


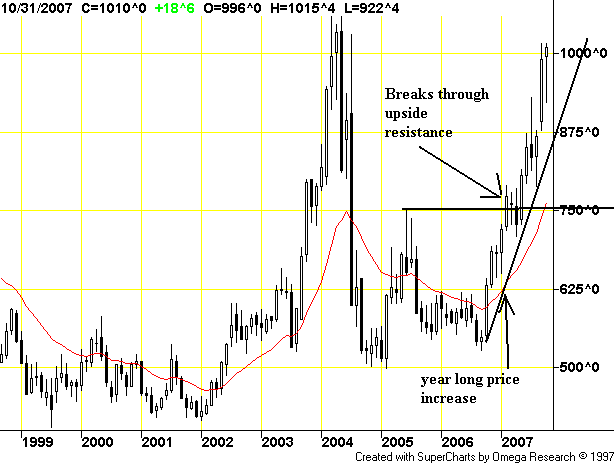
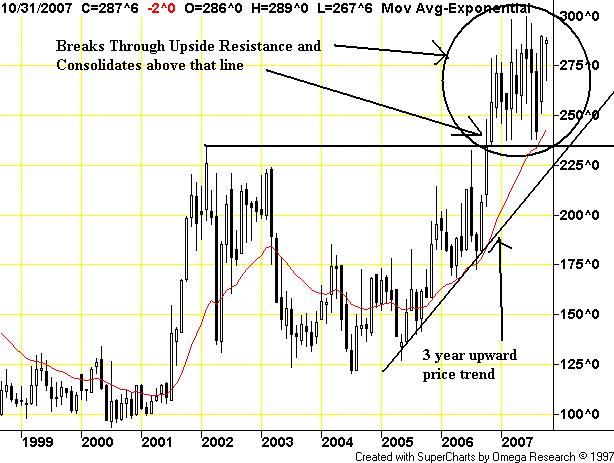
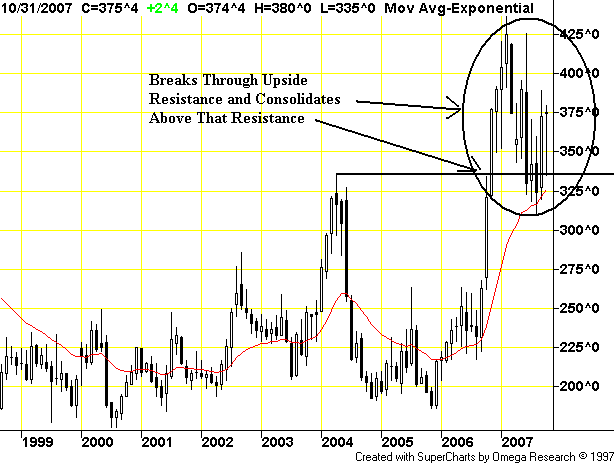
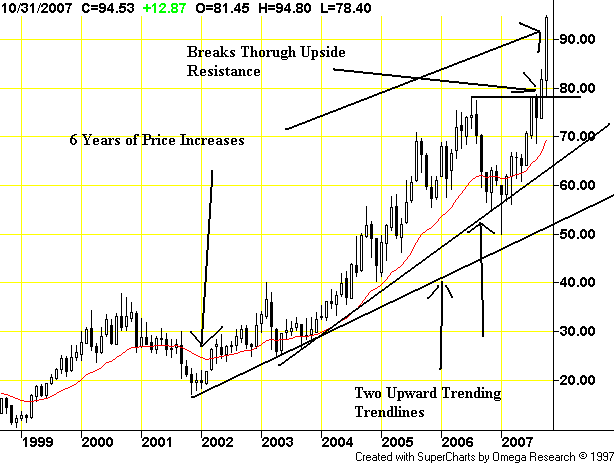
And as the charts below show, price increases caused by commodity inflation are hear to stay.

Wheat:


Soybeans


Oats


Corn


Oil


Propane


Heating Oil


Thank God none of these multi-year price increases have anything to do with inflation. Then we'd really be in trouble.

Citigroup To Write Down $6 - $10 Billion

From CNBC

Citigroup faces a write-down in the range of $6 billion to $10 billion, mainly because of exposure to subprime mortgages and collateralized debt obligations, CNBC has learned.

Citigroup will be parting ways with CEO Charles Prince, according to sources.

Citi Chief Executive Officer Charles Prince has already offered to resign from his post, according to a person familiar with the situation, and the financial services company's board is expected to accept his resignation at an emergency meeting scheduled for Sunday.

The size of Citi's write-off is still being debated, though a source told CNBC that Citi's board is pressing company finance executives to clarify the issue. The firm's audit committee is also scheduled to meet Sunday, in advance of the emergency board meeting.


This should not surprise anyone. Financial firms are writing off tons of debt right now. Citigroup is one of the largest financial firms in the country and they are involved in just about everything.

Prince will be Citi's sacrificial lamb. Considering the breadth of the street's exposure to these items, blaming Prince is a pretty stupid idea. I'm sure everyone thought he was a genius when he thought Citi should invest in CDOs etc...

The article goes on to note that some analysts are forecasting broad writedowns across the industry, with Merrill, Bank of America, Wachovia and Morgan Stanley specifically named.