India’s GDP is expected to grow by 8.5% this year, and could grow even faster. Chetan Ahya and Tanvee Gupta of Morgan Stanley, an investment bank, predict that India’s growth will start to outpace China’s within three to five years. China will rumble along at 8% rather than double digits; India will rack up successive years of 9-10%. For the next 20-25 years, India will grow faster than any other large country, they expect. Other long-range forecasters paint a similar picture.India’s GDP is expected to grow by 8.5% this year, and could grow even faster. Chetan Ahya and Tanvee Gupta of Morgan Stanley, an investment bank, predict that India’s growth will start to outpace China’s within three to five years. China will rumble along at 8% rather than double digits; India will rack up successive years of 9-10%. For the next 20-25 years, India will grow faster than any other large country, they expect. Other long-range forecasters paint a similar picture.
Several factors weigh in India’s favour. The first is demography. Indians are young (see chart 1). “An ageing world needs workers; a young country has workers,” says Mr Nilekani. Previous Asian booms have been powered by a surge in the working-age population. Now it is India’s turn. The proportion of Indians aged under 15 or over 64 has declined from 69% in 1995 to 56% this year, says the UN. India’s working-age population will increase by 136m by 2020; China’s will grow by a mere 23m, says Morgan Stanley (see chart 2).
.....
India’s second advantage is that the economic reforms of the early 1990s have unleashed an explosion of pent-up commercial energy. Tariff ramparts have been torn down (see chart 3). The “licence raj”—a system under which it seemed that a businessman could not pick his teeth without a permit—has been swept aside. Private firms have been forced to compete with the world’s best. Many have discovered that they can. Exports have shot up.
Monday, October 4, 2010
Don't Forget About India


Thursday, March 15, 2012
The BRIC Countries: India
India is developing into an open-market economy, yet traces of its past autarkic policies remain. Economic liberalization, including industrial deregulation, privatization of state-owned enterprises, and reduced controls on foreign trade and investment, began in the early 1990s and has served to accelerate the country's growth, which has averaged more than 7% per year since 1997. India's diverse economy encompasses traditional village farming, modern agriculture, handicrafts, a wide range of modern industries, and a multitude of services. Slightly more than half of the work force is in agriculture, but services are the major source of economic growth, accounting for more than half of India's output, with only one-third of its labor force. India has capitalized on its large educated English-speaking population to become a major exporter of information technology services and software workers. In 2010, the Indian economy rebounded robustly from the global financial crisis - in large part because of strong domestic demand - and growth exceeded 8% year-on-year in real terms. However, India's economic growth in 2011 slowed because of persistently high inflation and interest rates and little progress on economic reforms. High international crude prices have exacerbated the government's fuel subsidy expenditures contributing to a higher fiscal deficit, and a worsening current account deficit. Little economic reform took place in 2011 largely due to courruption scandals that have slowed legislative work. India's medium-term growth outlook is positive due to a young population and corresponding low dependency ratio, healthy savings and investment rates, and increasing integration into the global economy. India has many long-term challenges that it has not yet fully addressed, including widespread poverty, inadequate physical and social infrastructure, limited non-agricultural employment opportunities, insufficient access to quality basic and higher education, and accommodating rural-to-urban migration.India looks more like Russia than Brazil. The country has some solid strengths -- especially in the intellectual property fields -- but still has a high rate of poverty, poor investment and a fairly stodgy political systems that gets in the way more than it helps overall.
Here's ho their economy breaks down:


Overall industrial production has been declining on a YOY basis over the last two years. Also note the dip into negative territory recently -- not a good sign.


Tuesday, September 3, 2013
India Prints Weak GDP Number, Adding Further Downward Pressure To Indian Markets
Asia’s third-largest economy expanded by just 4.4 per cent compared with the same period in the previous year, from 4.8 per cent in the preceding three months. The figure was well below expectations and its worst performance since 2009, raising fresh doubts about government assurances that growth would pick up again later this year.
All see this from Bloomberg and Reuters.
However, India's real problem is that its growth model is no longer competitive, meaning the country must reallocate labor:
Let's take a look at the Indian ETF:

Indian prices are near their lowest level in over 1 1/2 years. Prices started dropping hard in early May, falling through the 200 day EMA. Since then, we've seen two attempted rallies that fell short. Prices moved through the 45-46 level (a key technical support area) earlier this month.
The underlying technicals for this chart are very bearish. Prices have dragged the shorter EMAs below the 200 day EMA, the MACD is negative and declining, the CMF is negative and volatility is increasing.
Wednesday, August 4, 2021
Coronavirus dashboard for August 4: in which I see reason for optimism
- by New Deal democrat
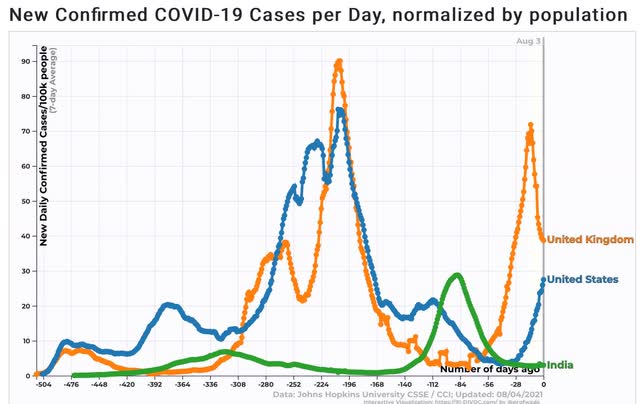
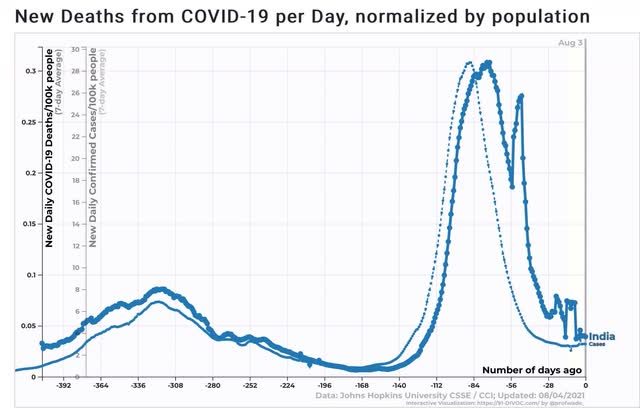
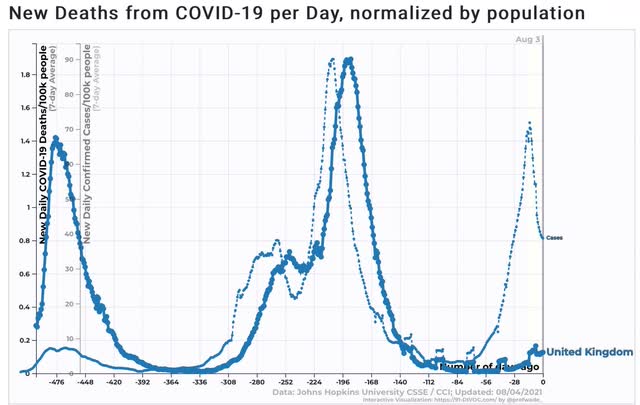
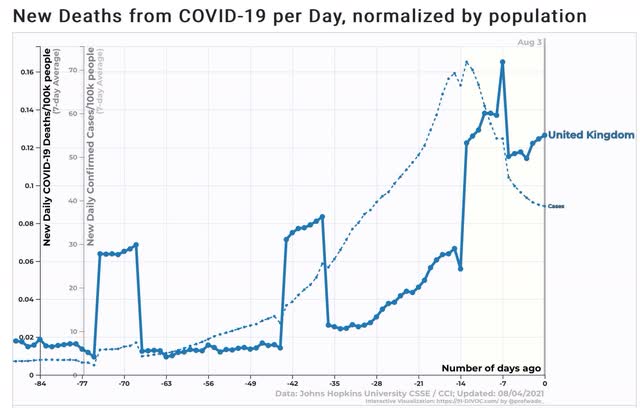
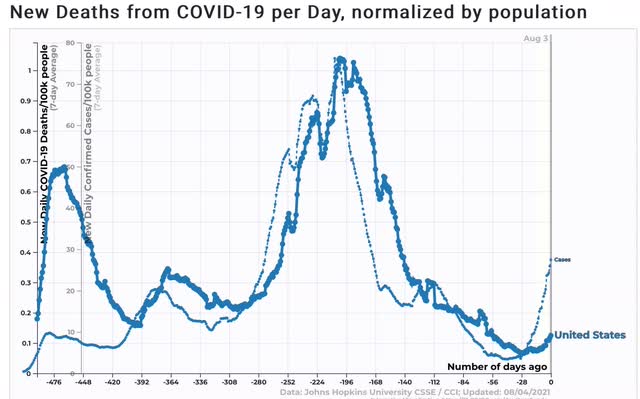
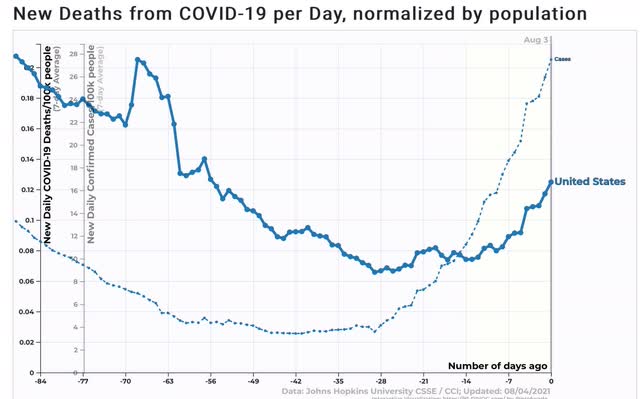
Turning to the second issue, what exactly is the “dry tinder” for Delta? Is it the unvaccinated? Everybody? Or just those with a particular genetic or other predisposition? If it is one of the first two, then in a couple of months the US will have stumbled into herd immunity. If it is the latter, then the door is open for yet another variant to raise hell this winter.
In India, a study showed that seroprevalence increased by more than 50% of the entire sampled population post-Delta, rising from 14% to 78% of the population. If this is true, then it appears that an absolute majority of the unvaccinated population at least is likely to become infected by Delta, whether or not the case is “confirmed.” In India, the “confirmed” cases only rose by 2% of the population!
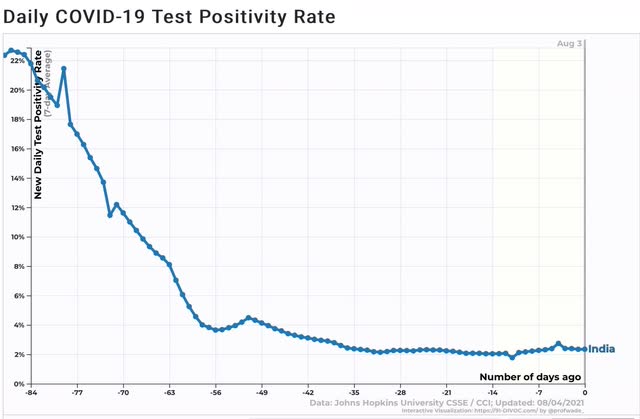
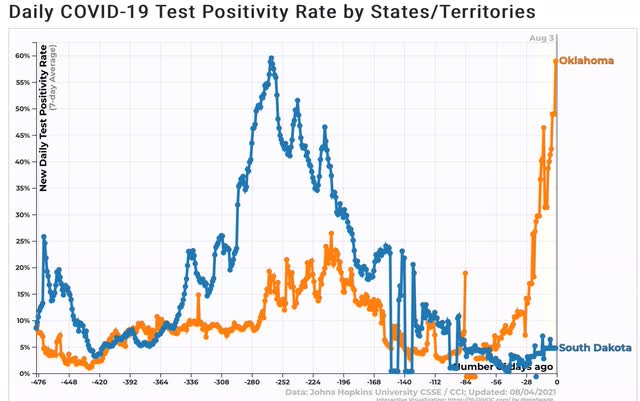
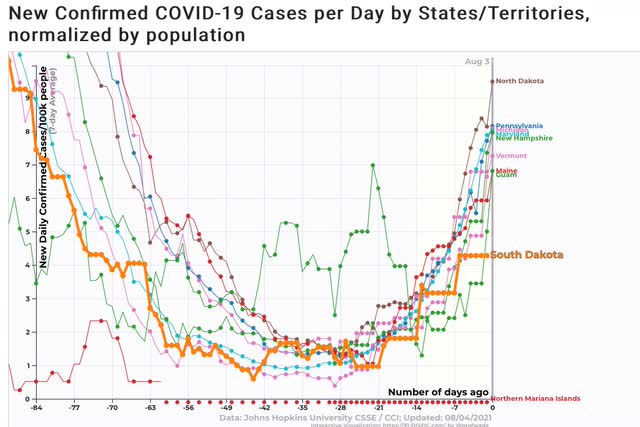
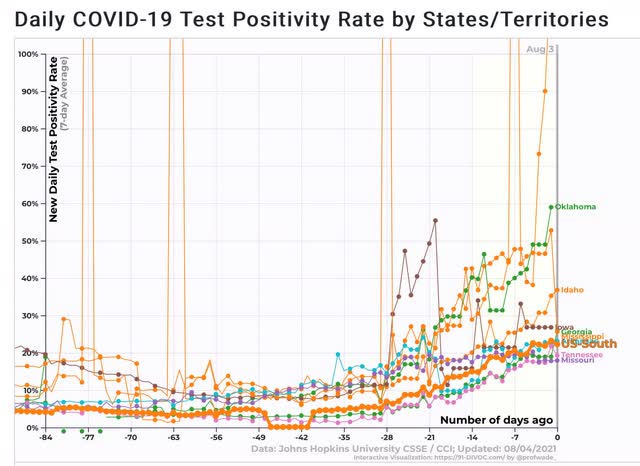
If I am correct that Delta is going to infect at least 50% of the US’s unvaccinated population over about the next month, then the remainder of this month and September are going to be brutal. But if about 70% of US adults are fully vaccinated by then, and over half of the rest have antibodies due to recent Delta infection, then with over 85% of US adults immune either the easy or the hard way, by late this autumn there may an actual return to near-normal life.
Tuesday, April 24, 2012
Is India's Growth in Trouble?

The India population stands at over 1.2 billion people. That means that GDP must keep growing at a fairly strong clip simply for the economy to tread water. A fast rate of growth is imperative for the country to lift the standard of living for more and more people.

Yet, the annual rate of GDP growth is dropping. While 6.1% is nothing to sneeze at, it must be placed into the population picture. Remember, with a growing population, rapid growth (8%+) is mandatory.
However, there are signs of problems. First, the central bank faces the classic policy squeeze of high inflation and slowing growth.

Indian inflation remains between the 8% and 10% level, where it has been for the better part of a year.

To tame inflation, the Indian central bank has been raising rates, which obviously has a negative impact on overall economic growth.

The above chart of the rupee shows the overall damage of this situation. After falling neary 20% (from 24 - 19.5), the rupee rebounded nearly 15%. However, since the mid-Spring, the rupee has been falling as investors have lost confidence in the economies ability to grow.
In addition, the possibilities for further growth seem to be lower. The Reserve Bank of India made the following points in their latest policy announcement:
Early indicators suggest that growth may have bottomed out in Q3 of 2011-12 but recovery may be slow during 2012-13. Lower global demand, domestic policy uncertainties and the cumulative impact of monetary tightening lowered the growth rate to below seven per cent over the last two quarters. Industrial growth remains subdued due to supply-side bottlenecks, particularly in the mining sector, and moderation in investment demand. With measures being taken to remove supply-side bottlenecks, progress on fiscal consolidation could create conditions for a more favourable growth-inflation dynamic.
.....
The growth slowdown has been driven by a sharp fall in investment, some moderation in private consumption and fall in net external demand. The drag from investment is likely to continue in the near term. Corporate investment intentions continued to drop during Q3 of 2011-12. Consultations with industry and banks suggest that new project investment continue to be sluggish. However, if increased capital outlays in the latest budget are speedily translated into government capital expenditure,it could crowd in private investment.
.....
The balance of payments (BoP) came under significant stress during Q3 of 2011-12 as the current account deficit (CAD) widened substantially and capital inflows declined.This resulted in a drawing down of foreign exchange reserves.The wider CAD, increase in external debt,weakening net international investment position (NIIP) and deteriorating vulnerability indicators underscore the need for more prudent external sector management and demand management policies to limit the absorption impact that is keeping import demand high.While capital inflows have revived somewhat in 2012, BoP risks remain due to high oil prices and uncertainties in the global economy.
The above picture is not pretty; instead, it shows an economy that is in major trouble. Consider the following points:
1.) Inflation is high, leading to
2.) Increased interest rates. This leads to
3.) Lower domestic investment
So, business is holding onto cash instead of putting it to work. That's before we get to the balance of payment (BoP) issue. Less money is coming into the country for investment, meaning the RBI had to tap its foreign currency reserves, draining its position.
There have been some great blog posts on this issue that really cover the issues well.
India and RBI: reality bites (Beyond Brics)
India rate cut; that's it for now (Beyond Brics)
India's reforms: finish the job (Free Exchange)
Tuesday, December 11, 2012
The Problem Of Doing Business In India
Global telecommunications giant Vodafone should be one of the success stories of investing in India. Instead it is a cautionary tale about barriers to foreign investment the country badly needs
Vodafone’s entry into the fast-growing market was well-timed and profitable. In 2007, it paid $11.2 billion for a two-thirds stake in Hutchison Essar. Now its mobile subscribers in India have increased more than fourfold to 127 million.
But then came the tax bill: Indian officials slapped the company with a $2.5 billion capital gains charge for the purchase, and alarm bells started ringing.
It was an interpretation of the country’s tax law without precedent, an attempt to raise money on a transaction that took place outside India, and even more controversially taxing the buyer rather than the seller, a Chinese firm. Since then, the government has opened retroactive tax investigations into hundreds of other deals involving foreign companies.
“We have received feedback from many foreign investors that the growing
unpredictability in India’s tax policies creates unquantifiable risks in investment planning,” the ambassadors of the United States, Britain, the European
Commission and four other countries wrote in a letter to India’s finance minister. “We are concerned that this uncertainty could affect the confidence of those thinking of investing in the Indian market, who may seek an alternative destination for FDI.”
I can tell you from a professional point of view, that the tax aspects of this deal were analyzed well in advance of the deal being done. That's just the way these deals work. I can also tell you that this decision came as a huge shock to those involved. It's simply not possible to do any meaningful business in this type of environment.
But according to Western business leaders and diplomats, one problem stood out above all others: the sheer unpredictability of doing business in India.
“What most deters investors is unquantifiable risk,” said one foreign business leader who spoke on the condition of anonymity for fear of harming his business interests. He complained about murky laws and poorly defined regulations that leave bureaucrats with the power to make arbitrary and sometimes opportunistic decisions, and that make investment expensive and risky. “There is a love of opaqueness and ambiguity.”
Wednesday, February 20, 2013
India's Growth Problems in Detail
Gross Domestic Product (GDP) at factor cost at constant (2004-05) prices in the year 2012-13 is likely to attain a level of Rs.55,03,476 crore, as against the First Revised Estimate of GDP for the year 2011-12 of Rs. 52,43,582 crore, released on 31st January 2013. The growth in GDP during 2012-13 is estimated at 5.0 per cent as compared to the growth rate of 6.2 per cent in 2011-12.
These are of course estimates, or someone's best statistical analysis based on current factors. In other words, it could change at any time.
However, there are other structural problems, as pointed out in a recent IMF report:
The economy is in a weaker position than before the GFC, with strictly circumscribed policy space and greater domestic and external vulnerabilities. Inflation and the fiscal deficit remain among the highest in EMs. At the same time, the financial positions of banks and corporates, both strong before 2009, have deteriorated. The current account deficit (CAD) widened to 4.2 percent
of GDP in 2011/12 and other external vulnerability indicators have deteriorated, which led to a sharp depreciation of the rupee in 2011 and early 2012.
Put another way, this is not the relatively simply situation where a country that supplies cheap labor to the world sees a period of slow growth because the rest of the world is slowing down, and therefore not purchasing that labor. There are other issues that are contributing to the slowdown.
The IMF has identified three problems on the supply side that are hurting growth:
Rising policy uncertainty. In particular, high profile tax policy decisions announced in the 2012/13 Budget have reduced foreign investors’ interest in India, while the increasing difficulty of obtaining land use and environmental permits have raised regulatory uncertainty for infrastructure and other large-scale projects.
Delayed project approvals and implementation. As a reaction to recent high-profile governance scandals, project approvals, clearances, and implementation have slowed sharply.
Supply bottlenecks are particularly pronounced in mining and power, with attendant consequences for the broader economy, especially manufacturing.
In addition, India has a high budget deficit:

And current account deficit:

The biggest problem faced by India is that as its rate of growth slows, it won't be able to absorb its population growth into the ranks of the employed. Remember that with a population of over 1 billion, India needs a very high growth rate just to keep up with population growth. Slow economic growth down and you get an increase in poverty.
Wednesday, March 26, 2014
India ETF Breaks Through Resistance

The Indian ETF above had been hitting resistance in the upper 56-upper 57 region since 4Q of 2013. However, prices have now moved through that level and are advancing higher. The reason is hope the new government will be more business friendly:
Friday, September 10, 2021
Coronavirus dashboard for September 10: was Labor Day indeed the peak of the Delta wave?
- by New Deal democrat
I have been saying for some time that the Delta wave would probably peak around Labor Day. It’s not certain yet, but it is looking increasingly likely to have been the case.
The Delta wave struck in both the US and Israel at almost the same time, with almost the same vaccination profiles. Here’s what cases per capita (bold lines) and deaths per capita (dotted lines) look like for each:
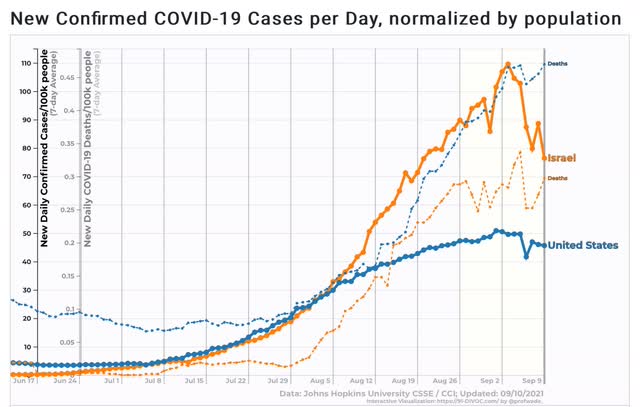
Cases in both countries appear to have peaked in the last week (repeating the pattern in the Delta waves in India, the Netherlands, and the UK). Deaths have either stabilized or (more likely) are still slowly increasing.
Data in the US was affected by the Labor Day weekend. Here is the daily count of cases for the last 4 weeks in the US:
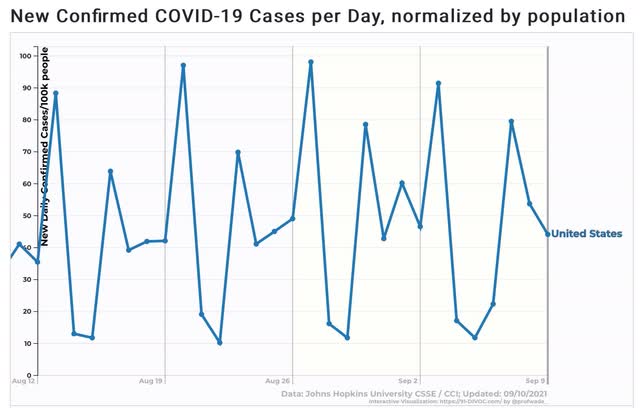
Note the difference in last Monday and Tuesday, the 6th and 7th, compared with the prior three weeks. The weekly average of cases is down from one week ago because the two days combined did not have as many cases reported as in the previous week. So we won’t have a real measure until next Monday’s and Tuesday’s cases are reported for comparison.
Some further good news is that there is a clear uptrend in only 10 States, of which 9 are relatively small and/or rural. In the remaining State, Pennsylvania, the uptrend is quite small:
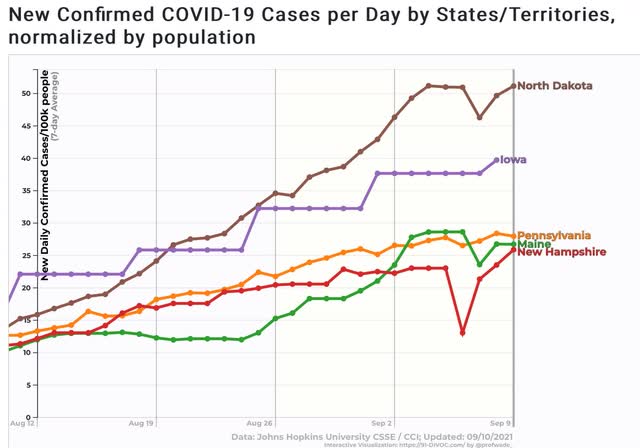
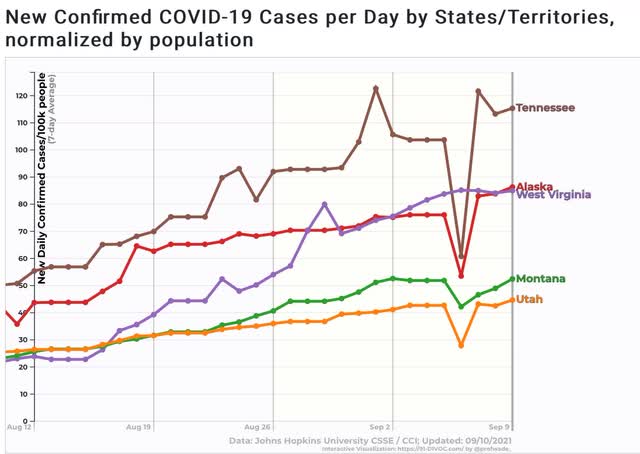
Once again, we will have to wait for next week to see if this was just an artifact of Labor Day or holds up.
But if we are at or have just passed the peak of the Delta wave, now is a good time for a quick review of my forecasting of the Delta wave, which began back in June, while national case counts were still declining, here and here, when I said
As the “Delta” variant becomes more widespread in the next 4 to 8 weeks, it will be a real challenge for the relatively unvaccinated States
And further that:
If Missouri’s rate continues to rise (and, as we’ll see below, there is every reason to expect that to happen), then COVID is going to burn through Missouri’s (and other similarly situated States’) population in the next few months like a forest fire exploding uphill.
If these States’ trends continue - and there is no reason to think their populations are going to change their minds about vaccines, masking, or social distancing at this late date - then they will be in the thick of a “Delta wave” in about 2 to 4 weeks, with many other States in the Deep South and interior West close behind
By early July, right as the upturn in cases was beginning, I wrote:
The bad news is that the “delta wave” is spreading, and we should expect a real outbreak on the order of last summer’s by early August. The *relatively* “good” news is that the death rate is likely not to be nearly so bad, if the experience in the UK is any guide.
“I expect the situation for all of the above States [AR, MO, NV, and FL], except possibly Arizona, to change considerably for the worse before the end of this month.”
“If the US follows the same course as the UK, 1 month from now the US will have about 1000 deaths per day.”
“So, brace yourselves. Cases have nearly tripled in the US over the past 2 weeks. Deaths are likely to increase to nearly 1000/day over the next 2 to 4 weeks.”
By the end of July, I was looking for when the peak would occur:
“It seems pretty clear that Delta burns through the dry tinder very fast - on the order of 9 to 12 weeks from onset to peak, based on the experience of the UK and India, respectively. The US is 7 weeks past its trough in cases, so it is a fair hypothesis that the Delta wave will reach its peak at some point in the next 2 to 5 weeks - roughly at some point in the second half of August or early September.”
“from prior trough to peak took 12 weeks in India, and 9 weeks in the UK. During that time, in India *confirmed* cases rose 35x. In the UK it was 25x. Seven weeks in, the US has seen an 8x rise in cases.”
[Note: last week, the US had seen a 14-fold increase in cases from the end of June trough.]
And also here. And then two weeks ago:
“So if the pattern continues, it looks like the Delta wave is about 1 week from peaking - I.e., right about and maybe a little before Labor Day.”
Since no critical self-analysis would be correct without acknowledging my misses, one area where I was wrong, at least early on, was based on the seropositivity report out of India that during the Delta wave over 50% of the population had been infected, based on seropositivity samples.
So in the late July note I referenced above, I wrote:
“If we use the UK and India as our range, when it comes the peak in the US will be about 280,000 to 400,000 cases/day!
“If I am correct that Delta is going to infect at least 50% of the US’s unvaccinated population over about the next month, then the remainder of this month and September are going to be brutal. But if about 70% of US adults are fully vaccinated by then, and over half of the rest have antibodies due to recent Delta infection, then with over 85% of US adults immune either the easy or the hard way, by late this autumn there may an actual return to near-normal life.”
Based upon the same estimate that 50%+ of the population had been infected in India, I also initially specter cases to rise right into October.
This was wildly high (at least so far!). Trevor Bedford, who wrote in July that he expected Delta to infect about 35 million people before the wave was over, looks to have been closer to the mark. Since the end of June there have been a little over 7 million *confirmed* new cases, with at least as many so mild or asymptomatic as to never have been confirmed by testing. If the wave recedes as quickly as it hit (a *very* optimistic scenario), that would total about 28 to 30 million cases in total.
So where do we go from here? One month ago I wrote:
“Once Delta burns through the dry tinder nationwide, which is looking more and more to happen sometime around Labor Day, just what % of all Americans have actually been infected by COVID becomes determinative in what is likely to happen next.”
Since early July about 20 million people, or 7% of the US population, have become fully vaccinated. If that rate continues over the next 2 months, then 60% of the total US population will have been fully vaccinated. If Delta infects a total of 30 million since its onset, in addition to the estimated 20% previously infected, that gives us a total of 30% of Americans with antibody resistance of some efficacy. If those 30% are randomly allocated between vaccinated and unvaccinated, this gives us a total of about 72% of Americans with either vaccine or natural resistance as of the end of October. Not enough for herd immunity, but certainly enough to limit the prevalence of the next wave.
Additionally, with the Biden Administration, and some States and localities taking tougher measures to mandate vaccinations - and here I am particularly thinking of the LA School District’s mandatory vaccination policy, which I suspect will spread like wildfire to many other large urban school districts - we are likely to get a boost of at least a few more % of vaccinations among the populace.
So, with full understanding that there are lots of unknowns, my best guess as to the near future is:
1. We are at or have just passed the peak of the Delta wave.
2. Cases will decline, but at a rate much slower than at which they rose in July and August, as school openings, autumn sports, and increased indoor gatherings in the North give Delta some new dry tinder to burn through.
3. Another late autumn and winter wave looks likely, but not nearly as bad as last winter’s, and probably not as bad as this summer’s Delta wave; and it will remain a wave very much concentrated on the vaccine holdouts who manage to dodge the various mandates that are likely to increase sharply.
Thursday, June 21, 2012
The Problem With India
GrowthLet's place the above information in context:
5. Economic activity in 2011-12 moderated sequentially over the quarters to take growth to a low of 5.3 per cent in Q4, though for the year as a whole it was 6.5 per cent. Deceleration in industrial production from the supply side and weak investment from the demand side have, in particular, contributed to the growth slowdown. The index of industrial production (IIP) increased by just 0.1 per cent in April 2012. Even as the manufacturing Purchasing Managers’ Index (PMI) for May suggested that industrial activity remains in an expansionary mode, there is no question that the pace of expansion has slowed significantly.
6. In this context, it is relevant to assess as to what extent high interest rates are affecting economic growth. Estimates suggest that real effective bank lending interest rates, though positive, remain comparatively lower than the levels seen during the high growth phase of 2003-08. This suggests that factors other than interest rates are contributing more significantly to the growth slowdown.
7. Further, one implication of the rupee depreciation over the past several months is that domestic producers have gained in competitiveness over foreign producers. Over time, this should result in expanding exports and contracting imports, thus acting as a demand stimulus.
Inflation
8. During 2011-12, headline WPI inflation rate moderated from a peak of 10.0 per cent in September 2011 to 7.7 per cent in March 2012. However, during 2012-13 so far, provisional data suggest that it inched up from 7.2 per cent in April to 7.6 per cent in May, driven mainly by food and fuel prices. Primary food articles inflation rose from negative [(-) 0.7 per cent)] in January to 10.7 per cent in May largely due to a sharp increase in vegetable prices. Protein inflation continued to be in double digits. With food prices contributing so heavily to headline inflation, the performance of the south-west monsoon will also play a role in determining inflationary conditions over the course of the current year.
9. Though international crude prices have fallen significantly from their levels in April 2012, the rupee depreciation has significantly offset its impact on wholesale prices. Further, even at the current lower level of global crude oil prices, significant under-recoveries persist in respect of administered petroleum product prices. The positive development on the inflation front is that core (non-food manufactured products) inflation has trended down.
10. Consumer price index (CPI) inflation (as measured by the new series, base year 2010) rose from 8.8 per cent in February to 9.4 per cent in March and further to 10.4 per cent in April. Significantly, CPI inflation, excluding food and fuel, was also in double digits suggesting that moderation in wholesale price inflation has not transmitted to the retail level.
11. Notwithstanding the moderation in core inflation, the persistence of overall inflation both at the wholesale and retail levels, in the face of significant growth slowdown, points to serious supply bottlenecks and sticky inflation expectations. Also, in the absence of pass-through from international crude oil prices to domestic prices, the consumption of petroleum products remains strong distorting price signals and preventing the much needed adjustment in aggregate demand. The consequent subsidy burden on the Government is crowding out public investment at a time when reviving investment, both public and private, is a critical imperative. The widening current account deficit (CAD), despite the slowdown in growth, is symptomatic of demand-supply imbalances and a pointer to the urgent need to resolve the supply bottlenecks.

Growth is clearly decelerating. Growth has moved from 9.4% in early 2010 to 5.3% now. While this rate of growth still looks impressive, the overall decline (which has been consistent) is obviously concerning. Also note that with one of the largest populations in the world -- and a population that is overwhelmingly poor -- India needs to maintain a far faster growth rate than a developed country.

The combination of slower growth and higher inflation places the central bank in a terrible policy bind. If it raises rates to slow inflation, growth will drop. If it lowers rates to increase growth, inflation picks up. It's a classic no-win scenario.

In addition, among major countries, India has the highest rate of inflation by far.


In short, the problems are mounting for India. The real problem appears to be political, as the ruling parties don't have the will to actually tackle these problems.
Tuesday, July 16, 2013
India Raises Two Key Interest Rates To Stem Rupee's Decline

The chart above shows the rupee's ETF. Over the last two months, it has moved through four different areas of support. It has slow dropped below the 200 day EMA and taken the traditionally very bearish chart pattern of using the short-term EMAs as technical resistance. The total drop amounted to a little under 12% from peak to trough.
Yesterday, the Reserve Bank of India took action, raising two key interest rates. Here is their policy announcement:
The market perception of likely tapering of US Quantitative Easing has triggered outflows of portfolio investment, particularly from the debt segment. Consequently, the Rupee has depreciated markedly in the last six weeks.
Countries with large current account deficits, such as India, have been particularly affected despite their relatively promising economic fundamentals. The exchange rate pressure also evidences that the demand for foreign currency has increased vis-a-vis that of the Rupee in part because of the improving domestic liquidity situation.
Against this backdrop, and the need to restore stability to the foreign exchange market, the following measures are announced:
- The Marginal Standing Facility (MSF) rate is recalibrated with immediate effect to be 300 basis points above the policy repo rate under the Liquidity Adjustment Facility (LAF). Consequently, the MSF rate will now be 10.25 per cent.
- Accordingly, the Bank Rate also stands adjusted to 10.25 per cent with immediate effect.
- The overall allocation of funds under the LAF will be limited to 1.0 per cent of the Net Demand and Time Liabilities (NDTL) of the banking system, reckoned as Rs.75,000 crore for this purpose. The allocation to individual banks will be made in proportion to their bids, subject to the overall ceiling. This change in LAF will come into effect from July 17, 2013.
- The Reserve Bank will conduct Open Market Sales of Government of India Securities of Rs.12,000 crore on July 18, 2013. Details of the securities included for the OMO sale auction will be announced through a separate press release tomorrow.
The Reserve Bank will continue to closely monitor the markets, the liquidity situation and the macroeconomic developments and will take such other measures as may be necessary, consistent with the growth-inflation dynamics and macroeconomic stability.
Bloomberg explains the moves:
India stepped up efforts to help the rupee after its plunge to a record low, raising two interest rates in a move that escalates a tightening in liquidity across most of the biggest emerging markets. Bond yields and the rupee surged.
The central bank announced the decision late yesterday after Governor Duvvuri Subbarao earlier in the day canceled a speech to meet the finance minister. The RBI raised two rates by 2 percentage points, and plans to drain 120 billion rupees ($2 billion) through open market sales of government bonds.
.....
The central bank increased the marginal standing facility and the bank rate to 10.25 percent from 8.25 percent, it said in a statement on its website. The monetary authority said it will conduct open market sales of government bonds worth 120 billion rupees on July 18, a step to drain cash from the economy.
“These moves will not only push up interest rates but also lead to tightened liquidity conditions,” said Prasanna Ananthasubramanian, an economist at ICICI Securities Primary Dealership Ltd. in Mumbai. “It’s quite surprising that the central bank has used these measures to support the rupee at a time when the economy is in such a bad state.”
Friday, May 25, 2012
The India Story is Deteriorating
India’s economy has been slowing for more than a year as corruption scandals involving senior members of the Congress-led coalition government have paralysed parliament and blocked key reforms to boost investment.
India’s macroeconomic landscape has deteriorated further since the start of the year. New Delhi’s fiscal and trade deficit have ballooned to 5.8 per cent and 9.9 per cent of GDP respectively, while inflation has shot back into double digits.
The Indian rupee also weakened to a record low against the dollar this week, which is likely to fuel inflation further in coming months.
Meanwhile, industrial output contracted 3.5 per cent in March 2012 and exports have been declining consistently, as demand in Europe for cheap Indian goods has dropped.
This is a huge story. Back in 2009, I noted that foreign economies would help to lift the world economy out of recession.
There's a great myth that goes around the Internet: the US doesn't make things anymore. If that were true, then we would have exported $1.8 trillion dollars of goods in 2008. And in 2008, we exported $108 billion of foods and beverages, $388 billion of industrial supplies, $457 billion of capital goods, $121 of automotive products and $161 billion of consumer goods. In other words, exports account for about 13% of GDP. And they may become far more important to US growth:This has occurred over the last 3 years, as US exports have been a bright spot in the expansion.
In the process of gorging on overseas goods and services, the US by happenstance fired up emerging economies such as China, Korea, Taiwan, India, Brazil and Mexico to build their productive capacities and spawn their own middle classes and consumer cultures. Paulsen has long called this trend the US's "emerging-market Marshall Plan."As US consumer spending slows we will import less, thereby lowering the total amount of imports in the trade deficit formula. At the same time, Emerging economies have seen a growing middle class which will want to buy more goods and services. And some of those will come from the US.
However, that story is now changing. As the above story notes, India is having serious problems that will hamper growth going forward. That means that overall, the world economy has a big problem.
Thursday, June 6, 2013
Market/Economic Analysis: India
“We used to think roads were the most important thing,” one government minister confided this week at a reception. “But it’s power, power, power.”
Economists who study the Indian economy – which has probably just overtaken Japan to become the world’s third largest measured by purchasing power parity, according to the Organisation for Economic Co-operation and Development – say that one of its peculiar weaknesses is the small size of its manufacturing sector.
And the government is struggling with questions about its overall legitimacy as allegations of corruption and graft continue:
Indian Prime Minister Manmohan Singh’s latest skirmish with corruption risks setting back efforts to spur growth, worsening a legislative logjam under a government set to pass the fewest bills ever in a full term.
Singh, 80, is grappling with renewed allegations that he has allowed corruption to fester after separate graft probes led to the May 10 dismissal of the law and railways ministers. Parliament ended two days early last week as opposition parties demanding the men’s resignation blocked proceedings, with proposals to open up the country’s pension and insurance industries to overseas investment still stalled.
.....
Over the last four years, at least six ministers have resigned after being accused in corruption cases, with the opposition parties claiming this is the most graft-ridden government in India’s history.
Both of these factors -- along with the general global slowdown -- is leading to slower GDP growth. From the latest GDP report:
GDP at factor cost at constant (2004-05) prices in the year 2012-13 is now estimated at Rs. 55,05, 437 crore (as against Rs. 55,03,476 crore estimated earlier on 7th February, 2013), showing a growth rate of 5.0 percent over the First Revised Estimates of GDP for the year 2011-12 of Rs. 52,43,582 crore, released on 31th January 2013.
.....
Growth rates in various sectors are as follows: ‘agriculture, forestry and fishing’ (1.4 percent), ‘mining and quarrying’ (-3.1 percent), ‘manufacturing’ (2.6 percent), ‘electricity, gas and water supply’ (2.8 percent) ‘construction’ (4.4 percent), 'trade, hotels, transport and communication' (6.2 percent), 'financing, insurance, real estate and business services' (9.1 percent), and 'community, social and personal services' (4.0 percent).
News stories have noted that the combined effect of a weakened central government, high budget deficit and overall beaurocratic inefficiency are hindering growth:
Singh’s eight-month push to boost the economy has in recent weeks floundered as protests over alleged graft in government disrupted parliament, impeding bills seeking to lure foreign capital, simplify taxes and provide more land for industry. At the same time, a record current-account deficit is constraining Indian monetary easing as the global recovery falters.
“Growth is weak and I am skeptical about a sharp bounce-back anytime soon,” said Radhika Rao, an economist at DBS Bank Ltd. in Singapore. “The Reserve Bank of India will be cautious about retail inflation and the high current-account deficit.”
The central bank also believes the Indian economy is in weak shape:
On the domestic front, most Members were of the view that the overall demand situation is very weak. Industrial growth is subdued - new orders are expanding only modestly and instances have been reported where even after placing orders, clients are advising manufacturers not to deliver goods. Downgrading of companies by rating agencies has gone up by 30 per cent. The services sector is also weak and productivity in services and manufacturing sectors has been adversely affected, leading to supply constraints. The supply response is low, notwithstanding sizable unutilized capacity in the economy. Profit margins have been squeezed due to minimum wages rising with consequent wage pressures in the organized sector.
For a more detailed look, see this link from the central bank.
The latest Markit manufacturing and service report do paint a picture of an economy that is growing, albeit barely in the case of manufacturing.
Firs is the manufacturing report:
Operating conditions in the Indian manufacturing economy stagnated during May. The seasonally adjusted HSBC Purchasing Managers’ Index™ (PMI™) – an indicator derived from individual diffusion indices measuring changes in output, new orders, employment, suppliers’ delivery times and stocks of purchases – fell from 51.0 in April to 50.1 and was at a 50-month low.
Reflective of weaker gains in incoming new work and persistent power outages, output decreased in May, the first decline registered since March 2009. That said, production fell only slightly. Order book volumes rose for the fiftieth consecutive month. The rate of expansion was, however, marginal and the slowest in that sequence. Panellists suggested that demand was maintained, but commented on increased competition for new work and tough market conditions overall, particularly at home. Encouragingly, foreign orders rose at an accelerated pace during May. Growth in export business was solid and the fastest since January. Monitored companies indicated strengthening demand from key export clients. Meanwhile, unfinished business levels increased, amid evidence of power and water shortages. Backlogs of work rose solidly and at the quickest pace in five months.
And then there is the services report, which was more bullish:
The seasonally adjusted HSBC Services Business Activity Index posted 53.6 in May, up from 50.7, pointing to a solid expansion in output, one that was the fastest in three months. This contrasted with a fall registered in manufacturing output, the first decline in 50 months. May data pointed to higher levels of new work placed at private sector firms in India. The rate of expansion was moderate and little-changed from April. Service providers stated that demand was stronger and new products were launched. Manufacturers reported weaker gains in incoming new work, tough market conditions and increased competition.
Let's turn to the charts of the Indian ETF

The ETF is still trading between the 55 and 62 lever. Momentum is fluctuating and prices are using the 200 day EMA line as technical support.
The main issue for the market is when will it break out of its range and what direction will it move in?