- by New Deal democrat
The housing market has historically been led by mortgage rates. And since those have been relatively rangebound for most of the past 2.5 years in the 6%-7% range, housing permits and starts have similarly followed.
This morning those trends continued. Total permits (dark blue in the graph below) increased 23,000 on an annualized basis to 1.482 million, while the less volatile single family permits (red, right scale) number declined -20,000 to 978,000. The slightly lagging and much more volatile starts number (gray, narrow) declined a sharp -170,000 to 1.324 million annualized:

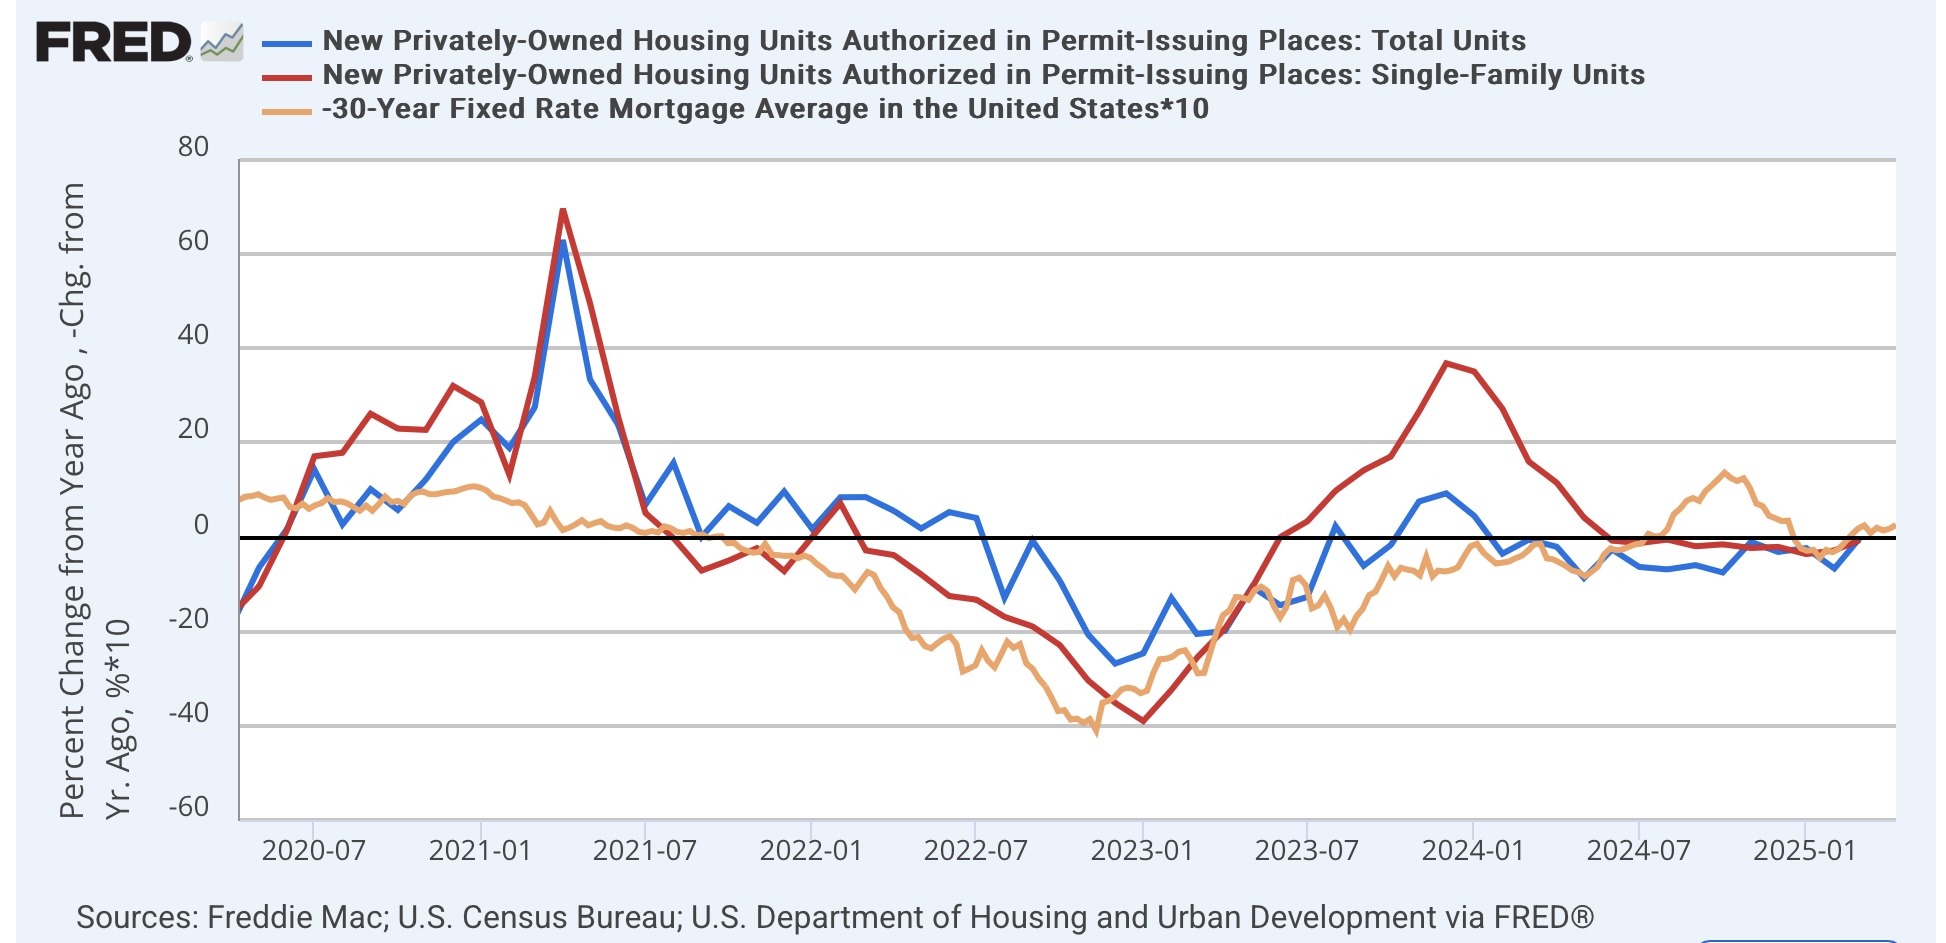
All of these are virtually unchanged from where they were a year ago:

Which is consistent with the lack of major changes in mortgage rates (gold, inverted, *10 for scale):
In the past year, I have paid ever more attention to the number of housing units under construction (blue in the graph below), which follows permits and starts with a further, sometimes considerable, lag; and which is the closest proxy for the actual economic impact of new housing construction. This declined another -19.,000 annualized, and is now -18.7% below its highest post-pandemic reading in October 2022:

In the above graph I also show the last shoe I would expect to drop before a recession, employment in housing construction (red, right scale). This has continued to increase, and made another post-pandemic record last month. I do not expect this levitation to last forever. As shown in the below historical graph, several times the delay has been between 1 and 2 years:

Since the significant downturn in units under construction began about 18 months ago, I suspect the turn in employment will take place within the next few months.
And needless to say, if construction including construction employment turn down at the same time as manufacturing, that would be an excellent recipe for the beginning of a recession.