- by New Deal democrat
Existing home sale by themselves are not that important economically, since there is a mere transfer in ownership, rather than a complete build. But they can help verify turning points, and in this case very importantly as to prices.
But first, sales declined slightly (-2,000) to 4.80 million annualized. This is the lowest seasonally adjusted monthly number since June 2020, is 20% off its post-pandemic peak, and is also the lowest in nearly 6 years excluding the worst of the pandemic months (via Mortgage News Daily; note this morning’s data is not included yet):

But we’ve known that home sales have been declining all this year in the face of Fed rate hikes and their attendant higher mortgage rates.
As I always say, sales lead prices. Since sales turned many months ago, when will prices turn? Remember that in “real,” income adjusted terms, median house prices have been as high as and even slightly higher than they were at the peak of the housing bubble over 15 years ago.
And here, we have important confirming data this month. The NAR does not seasonally adjust its measure of median existing home prices, so YoY is the only way to measure. My rule of thumb for such metrics is that they have peak when their YoY% increase is less than 1/2 of its peak increase in the past 12 months.
In August, the YoY% price increase was 7.7%:

That is less than 1/2 of the 16.5% YoY increase last August. It is also less than 1/2 of the YoY% increases in every month beginning November of last year through May of this year with the exception of March. In other words, existing home prices probably peaked sometime early this summer.
Since non-seasonally adjusted median *new* home prices likely peaked in June, per the same rule of thumb, as shown in the graph below:
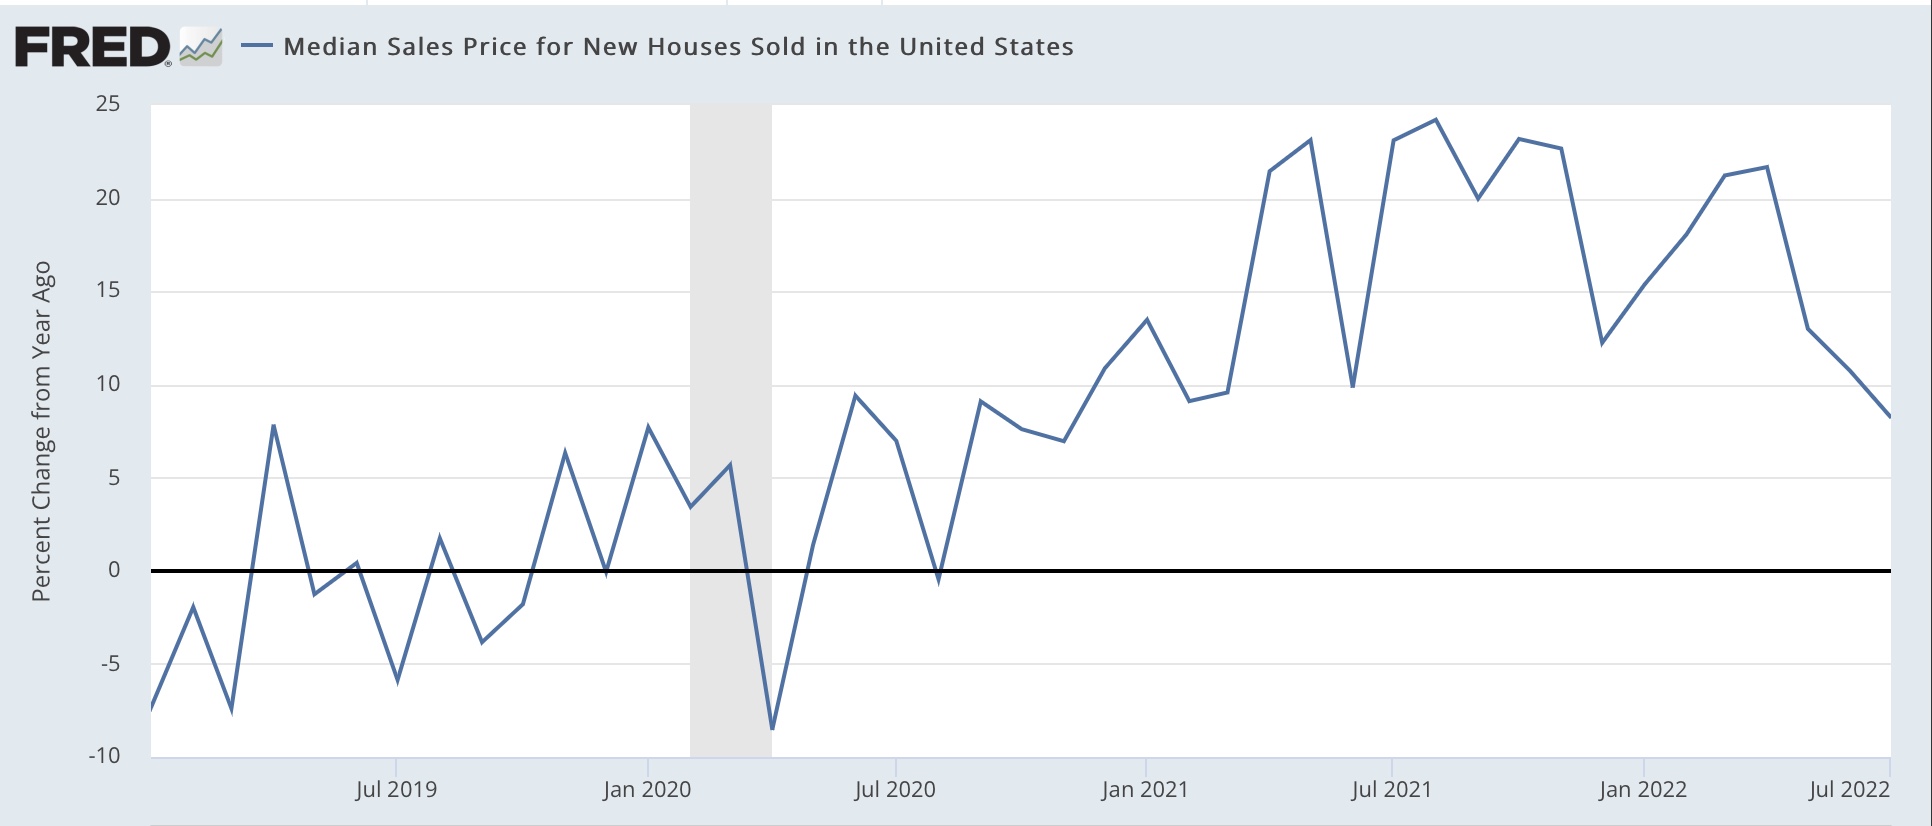
this means that prices are declining throughout the entire housing market.
Housing inventory is still tight, however. In August, there were 444,600 new listings and 779,400 total listings. As shown in the below graph, new listings (red) were only slightly below their pre-pandemic August average of 493,400, but total listings were about 650,000 below their pre-pandemic August average of 1,427,600:

New listings have generally been increasing, but they will have to increase a lot more for total listings to return to their pre-pandemic levels.