- by New Deal democrat
Last month I noted that, from here on, the comparisons with 2020 in housing would become much more challenging. And so they have.
While permits (gold in the graph below) did increase this month, their declining trend remains intact. Starts (blue), and more importantly, single family permits (red, right scale) - the least volatile measure of all - both decreased again, as they have almost relentlessly since the beginning of this year:
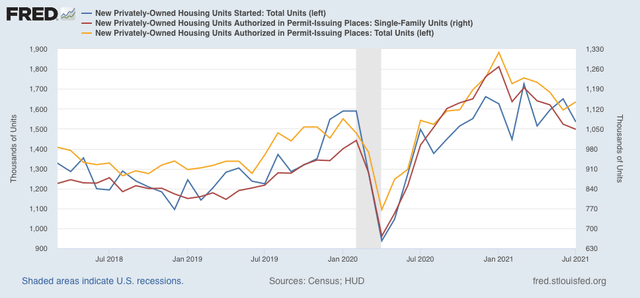
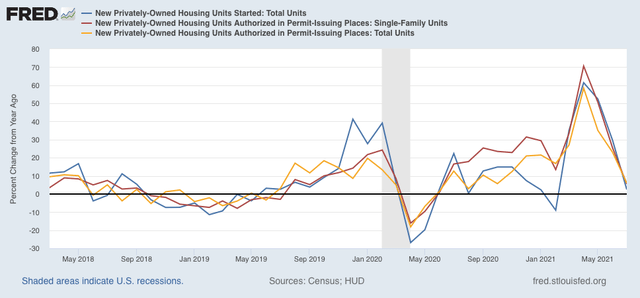
Viewed YoY, all three are only 2.5%-6.0% above last July:
Here is a graph I have run many times, the inverted YoY change in interest rates (blue) vs. the YoY% change in single family permits (red/10 for scale):
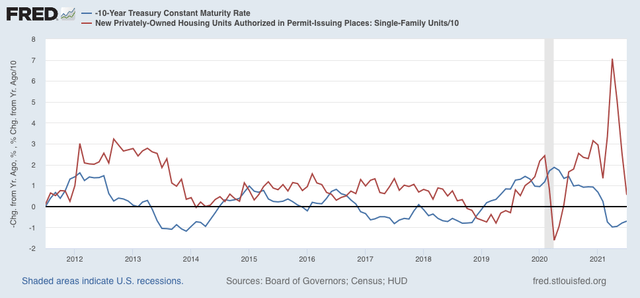
Note that in late 2018-early 2019, in the face of a similar increase in interest rates, permits actually declined YoY. Almost certainly, by September permits and starts will be negative YoY again.
All of which is of academic interest, except that housing is a very important long leading indicator for the economy. Starts are currently off about 7.5% from their peak, while both total and single family permits are off between 13% to 17%. In the past, when these have declined 20% from peak, it usually has resulted in a recession at some point 12+ months after the peak. Only one indicator, but still this is a yellow flag at minimum for the economy in 2022.