- by New Deal democrat
US cases August 4: 51,568
Average last 7 days: 59,182
US deaths August 4: 1,176
Average last 7 days: 1,057
(Source: COVID Tracking Project)
This is CNN’s latest map of States that require the wearing of masks (red):
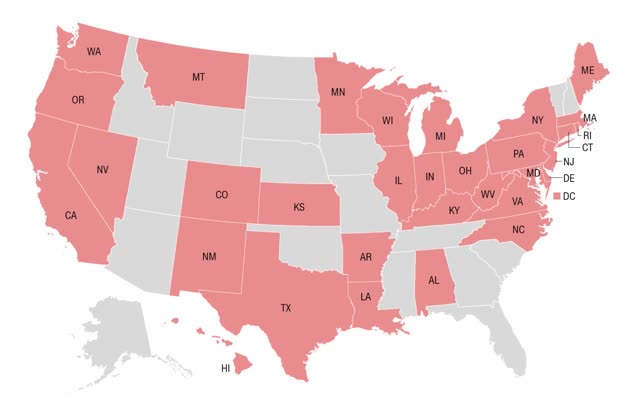
And here is the NYT’s latest map of counties based on the growth in new cases of COVID-19:
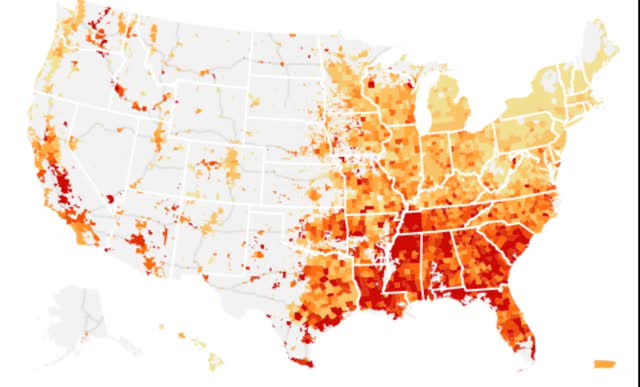
The two maps are very similar, with the notable exception of parts of Texas, which has had a mask-wearing requirement for the past month in most urban counties.
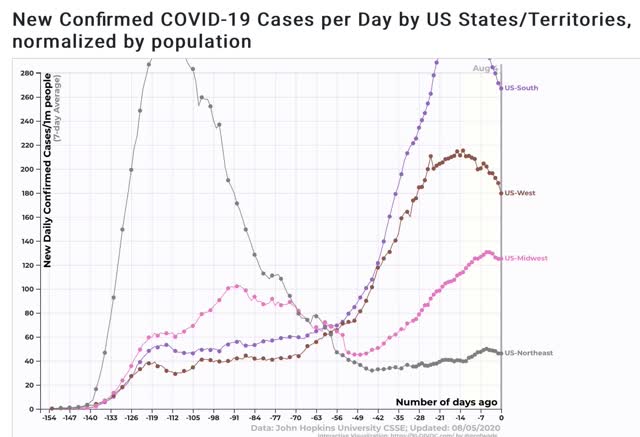
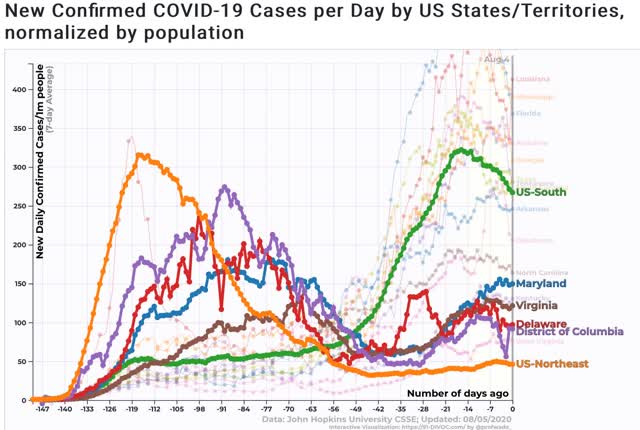
From 91-divoc.com, here is the breakdown in cases by region:
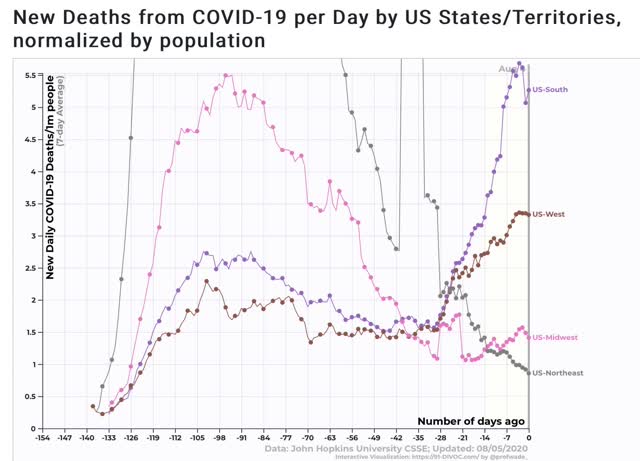
And here is the breakdown in deaths:
Because the above graphs place the Baltimore and DC metro areas in the South vs. the Northeastern megalopolis, below I have separately broken out DE, MD, DC, and VA and compared them with the two regions, first by cases per million:
And by deaths per million:
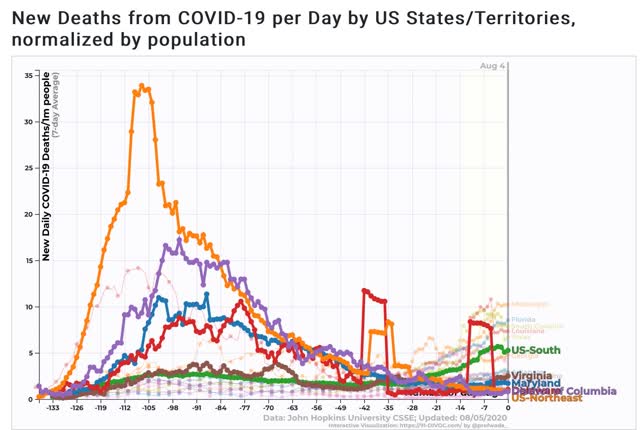
The four jurisdictions are among the lowest in the South (only rural West Virginia does better), but DE and DC are also better than the midwestern region for cases and deaths, and only MD is worse than the Midwest in deaths (not shown).
Here is what the South ex-DE, DC, MD, and VA looks like for cases and deaths, from Conor Kelly’s tableau page:
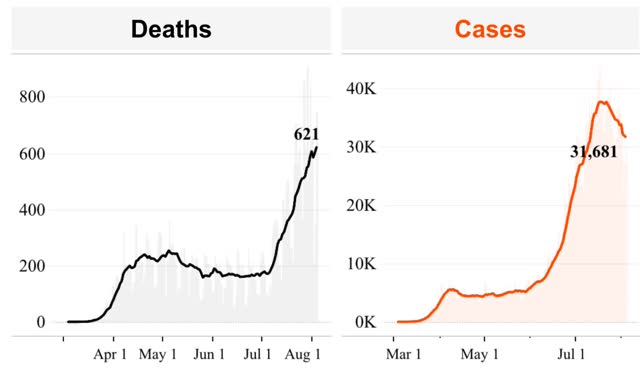
Because the Federal government cannot force the Trumpist governors in the Deep South and Arizona to take adequate precautionary measures, any Biden Administration is going to have to confront the problem of making sure those States do not continue to seed outbreaks, via returning vacationers, in the States that are willing to act responsibly. That may mean quarantining as NYS is doing; it may mean going further to establish a cordon sanitaire.
Finally, before anyone gets too excited about how well the Northeast is doing, here is the same graph of cases and deaths per million in immediately adjacent Canada:
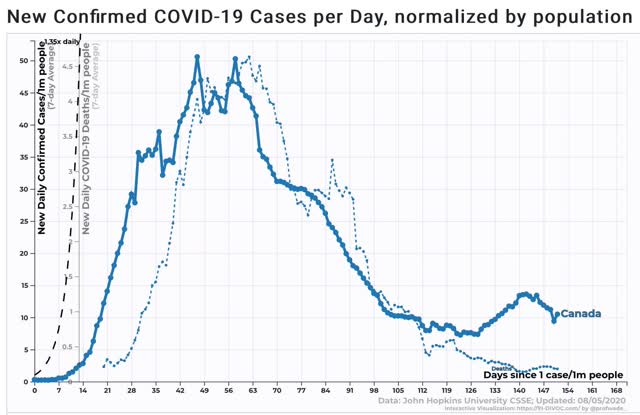
The US Northeast is currently running about 4x as many cases and deaths per million than Canada.