- by New Deal democrat
Let me catch up on some data I didn’t examine last week: the November JOLTS report.
It decomposes the jobs numbers into a number of metrics, but is less than 20 years old, so only covers one full business cycle, so is of limited forecasting use.
To reiterate, here is the order in which the JOLTS series peaked during the 2000s expansion:
- Hires peaked first, from December 2004 through September 2005
- Quits peaked next, in September 2005
- Layoffs and Discharges peaked next, from October 2005 through September 2006
- Openings peaked last, in April 2007
So to start, here are YoY hires and quits for the entirety of the series, measured YoY:
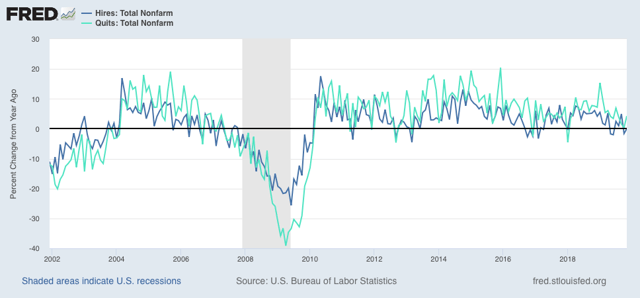
Hires has turned negative for some months in the past year, while quits remain positive YoY.
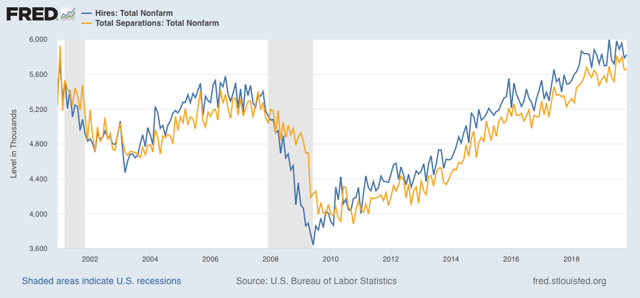
Next, as I have often said, hiring leads firing (actually, total separations). Here’s what that looks like for the entire series, first measured absolutely:
And here is the YoY change, plus the 4 week average of initial jobless claims (inverted) in red:
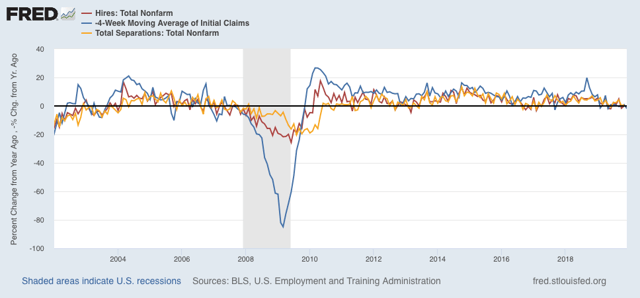
These aren’t as negative as prior to the 2007 recession, as compared in the two graphs below:
Present:
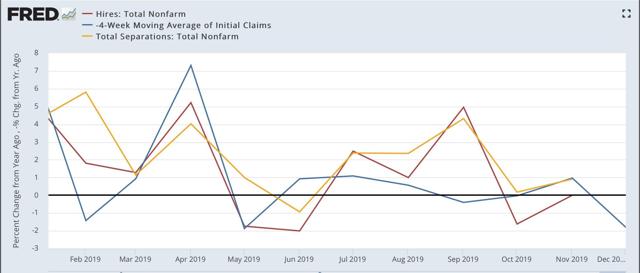
2007:
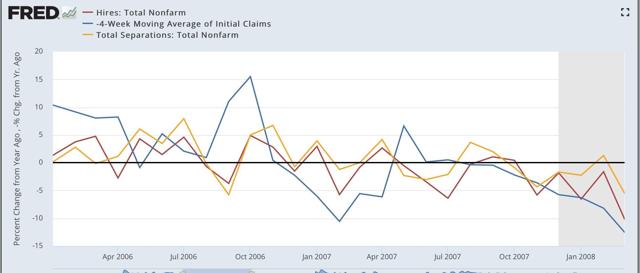
In 2007, both hires and initial jobless claims (inverted) were negative by as much as -5% YoY. In 2019, they’ve only been negative by about -2% at the worst.
The biggest difference between this cycle and the last has been in job openings, which I consider “soft data.” But because the difference is noteworthy, here it is, again shown YoY:
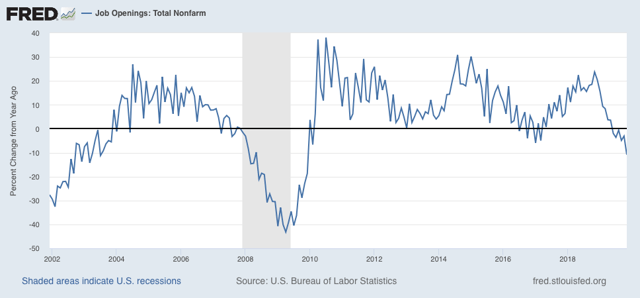
This series is consistent with its 2008 recessionary readings.
Again, analyzing with lots of caution, my take remains: slowdown, not recession at this point.