- by New Deal democrat
It’s a very slow, holiday-shortened economic week. We’ll get new home sales, plus personal income and spending Wednesday, and jobless claims as usual Thursday.
In the meantime, here is something I found revealing. It’s a map, created by Nathan Jordan, a college student from Alabama (I think), showing the county-level change in Presidential voting countrywide (except Alaska) from 2004 through 2020:
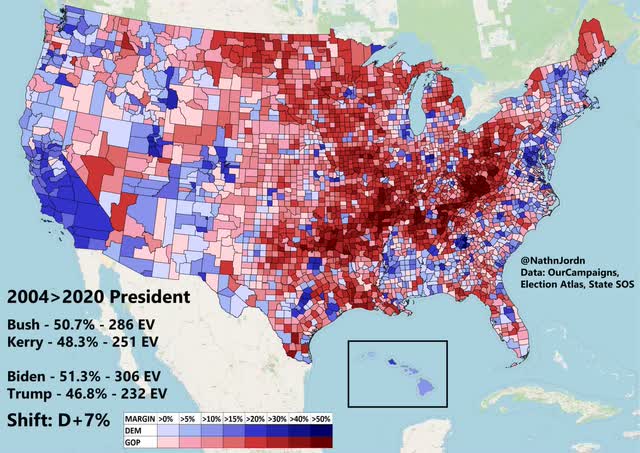
What was fascinating to me (because I am a nerd) is how closely the changes track some geographical features. The spine of the Appalachians stands out clearly, plus the Ozark mountains, and the red-shaft also appears to closely follow the Mississippi-Missouri-Ohio River valley system.
On the first pass, this certainly looks like an “It’s the economy, stupid!” story. But it’s more complicated than that.
First of all, here is a county-level map of Black population density:
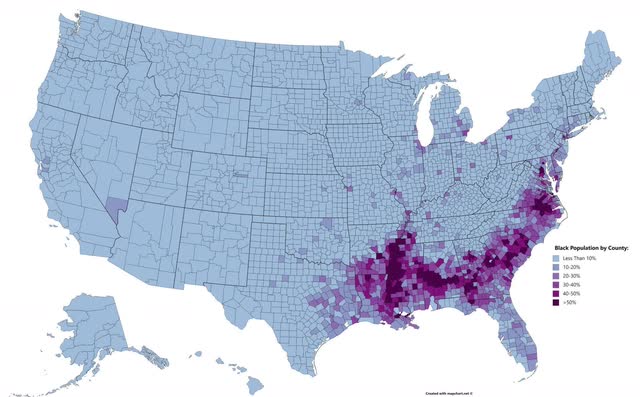
It closely matches the “black belt” - named for the soil color that supported the plantation economy not the skin color - in the Southeast over to Texas. In addition to the Northeast megalopolis, the blue shift matches up pretty well with this map as well.
But what about Hispanics? Well, here are two maps. The first, again, shows Hispanic population density by county:
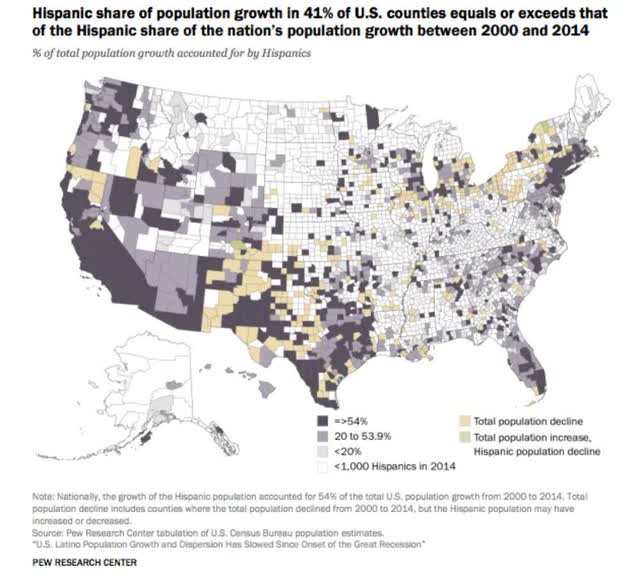
With the exception of east Texas and Wyoming, again the map appears to closely match up with the blue shift, especially in the West and Southwest, but also in the Northeast megalopolis.
This second map show the *change* in the Hispanic population by county between 1990 and 2018:
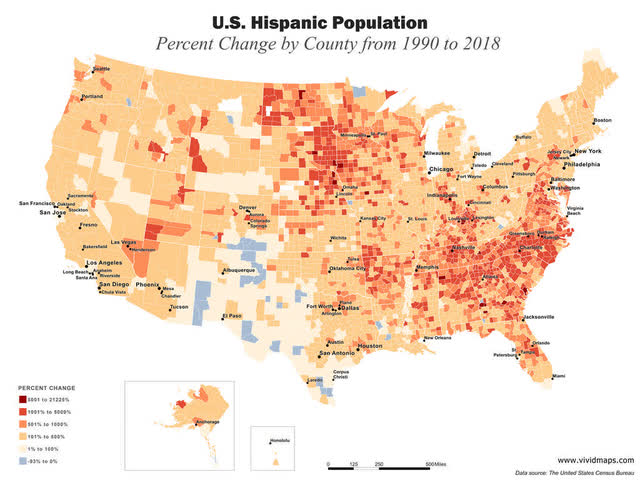
This shows that there was a big increase in the Hispanic in-migration to the upper Mississippi and Missouri valleys, but also to the Southeast and the Appalachians and Ozarks.
In other words, the areas of the country that have shown the biggest red-shift in the past 16 years shared two characteristics:
1. They were relative economic backwaters, with relative outmigration to the coasts, BUT
2. They experienced significant IN-migration of Hispanics (even if in relatively small *absolute* numbers - see the 1st map of Hispanic population density).
In short, these have been areas of significant economic malaise, where there is increased competition for jobs by a new “other” ethnic group. This is a potent recipe for a racial backlash.
I believe a substantial number of White voters can put racial animus aside if the economic pie is visibly growing for them. But when their economic condition is stagnating or worse, that racial animus is going to be a potent motivator for voting. I think this gets to the heart of why the Democratic Party has so badly lost in the whole Mississippi watershed area.