- by New Deal democrat
Here is my final nowcast for the Presidential 2020 election, based on State rather than national polling in the past 30 days, since that directly reflects what is likely to happen in the Electoral College. For this final installment, I am also including forecasts from 3 “fundamentals” models, including the one based on the Index of Leading Indicators that already forecast a result over half a year ago.
At only 2 days from Election Day, the polls are probably less than 1.5% off the final result. All of the fundamentals are known, and Trump’s attempt at an “October surprise” fizzled. There is some evidence of previously undecided partisan voters “coming home” in the past week or two. Aside from that, all that is left are brazen judicial shenanigans. In this last regard, here is a really helpful map of what days we can expect the ballot counting to be complete in various States, courtesy of Mike Sherlock a/k/a Mish:
At only 2 days from Election Day, the polls are probably less than 1.5% off the final result. All of the fundamentals are known, and Trump’s attempt at an “October surprise” fizzled. There is some evidence of previously undecided partisan voters “coming home” in the past week or two. Aside from that, all that is left are brazen judicial shenanigans. In this last regard, here is a really helpful map of what days we can expect the ballot counting to be complete in various States, courtesy of Mike Sherlock a/k/a Mish:
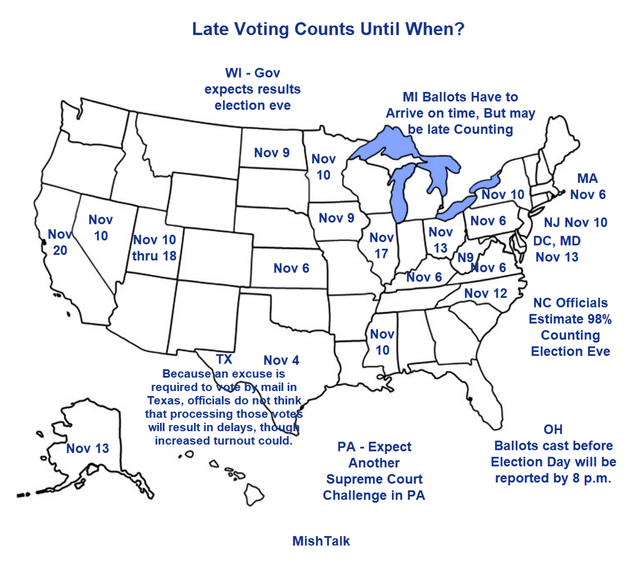
By November 6, unless the Supreme Court wants to end the American Republic in the next 5 days, we should have results from Pennsylvania and enough other States to know definitively who the victor is, if we don’t know already.
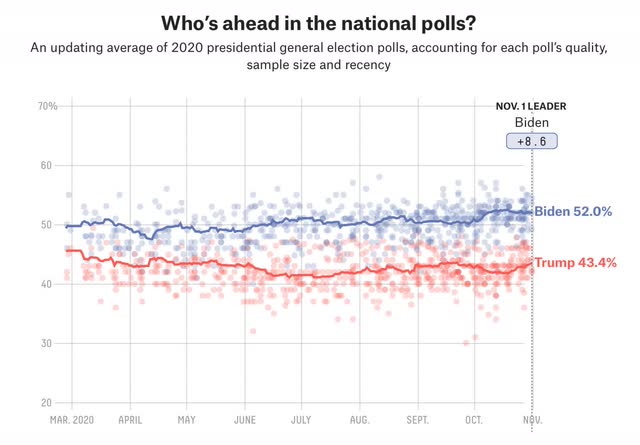
Once again, unlike 2016, Biden’s lead been at very least steady for nearly 5 full months:
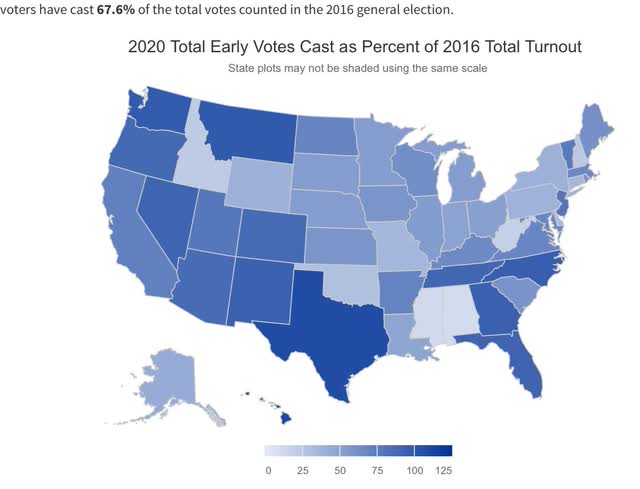
Not only that, but as of yesterday about 67% (about 94 million!) of the total number of ballots compared with 2016 have already been cast:
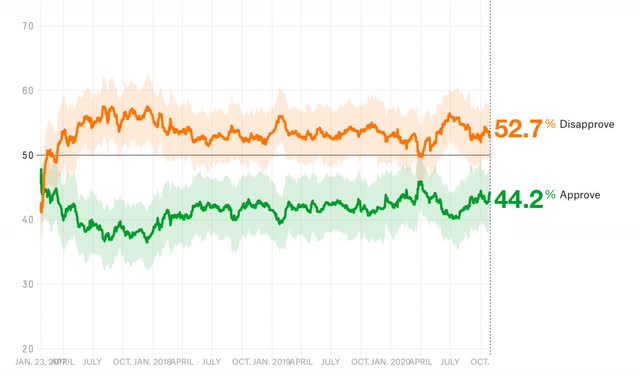
Trump has not made any extraordinarily incompetent and cruel mistakes since early October, and as it has always done in the past, his approval ratings have recovered to their normal range. This week his approval declined by -0.4% to 42.2%, while his disapproval rate also declined -0.9% to 52.7% — again, well within the normal range of approval going back over 3.5 years:
So, here are the final two maps through October 31 for the Presidential election. To refresh, in the first map:
- States where the race is closer than 3% are shown as toss-ups.
- States where the range is between 3% to 5% are light colors.
- States where the range is between 5% and 10% are medium colors.
- States where the candidate is leading by 10% plus are dark colors.
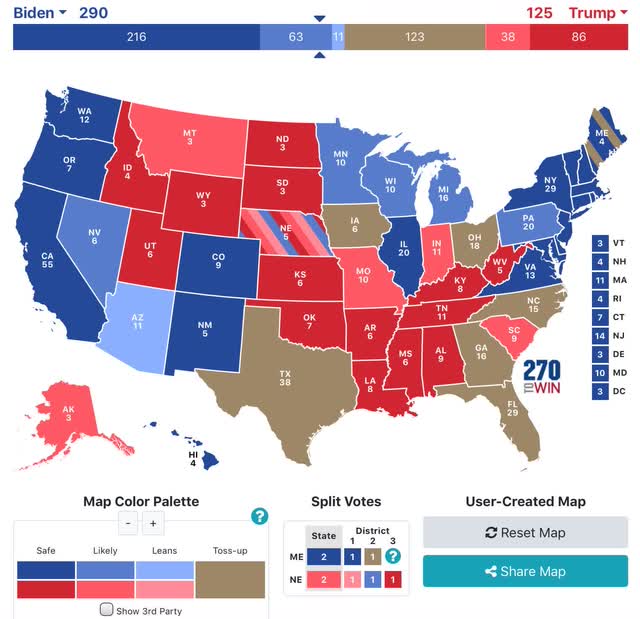
This week New Hampshire improved to “solid Biden,” and Nevada to “likely Biden.” Meanwhile Florida decline back to “toss-up,” Alaska to “likely Trump,” and Utah to “solid Trump.”
Once again, unlike 2016, Biden’s lead been at very least steady for nearly 5 full months:

Not only that, but as of yesterday about 67% (about 94 million!) of the total number of ballots compared with 2016 have already been cast:

Trump has not made any extraordinarily incompetent and cruel mistakes since early October, and as it has always done in the past, his approval ratings have recovered to their normal range. This week his approval declined by -0.4% to 42.2%, while his disapproval rate also declined -0.9% to 52.7% — again, well within the normal range of approval going back over 3.5 years:

So, here are the final two maps through October 31 for the Presidential election. To refresh, in the first map:
- States where the race is closer than 3% are shown as toss-ups.
- States where the range is between 3% to 5% are light colors.
- States where the range is between 5% and 10% are medium colors.
- States where the candidate is leading by 10% plus are dark colors.

This week New Hampshire improved to “solid Biden,” and Nevada to “likely Biden.” Meanwhile Florida decline back to “toss-up,” Alaska to “likely Trump,” and Utah to “solid Trump.”
Even so, Biden still has 279 “solid” or “likely” Electoral votes, enough to win without any “leaning” or toss-up States.
This final week I am also including a map that includes any State with a 1%+ differential to “lean Democrat/GOP” category:
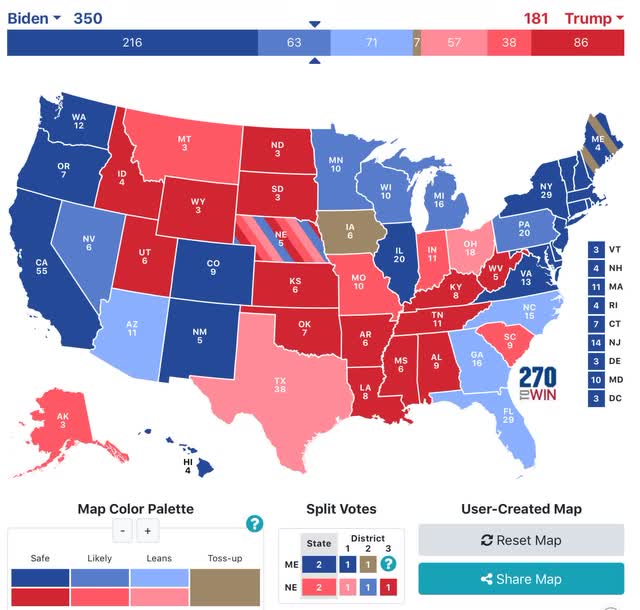
In perhaps the biggest shock of the 2020 race, Georgia looks likely to join North Carolina as a Blue State, following Virginia as the 3rd east coast State of the old Confederacy to do so. Ohio and Texas are slightly likely to remain Trump States. The only true remaining toss- ups are Iowa and Maine’s 2nd Congressional District.
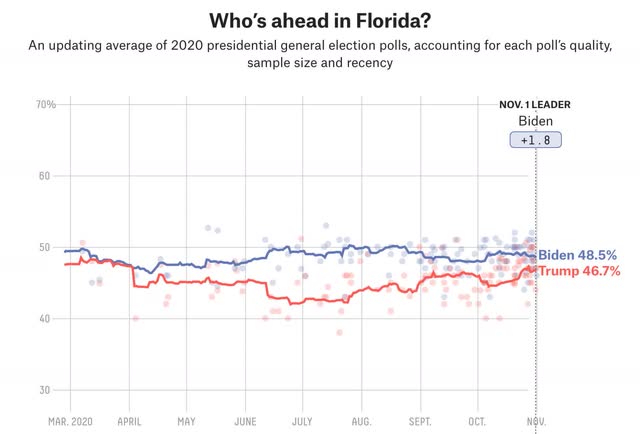
Biden’s support remained at 50%+ in Michigan, Minnesota, Nevada, and Wisconsin. But P en. nsylvania and Nevada declined below 50%, although above 49%. North Carolina also remained at 49%+. Florida declined below 49%, joining Arizona. Florida is the only State I am really worried about “flipping” from Biden to Trump, as it appears enough Cuban Americans and elderly retirees have been “coming home” to the GOP:
But perhaps more importantly, here is Pennsylvania, hanging tough for Biden. Although I won’t post the graphs, Minnesota, Wisconsin, and Michigan are similar:
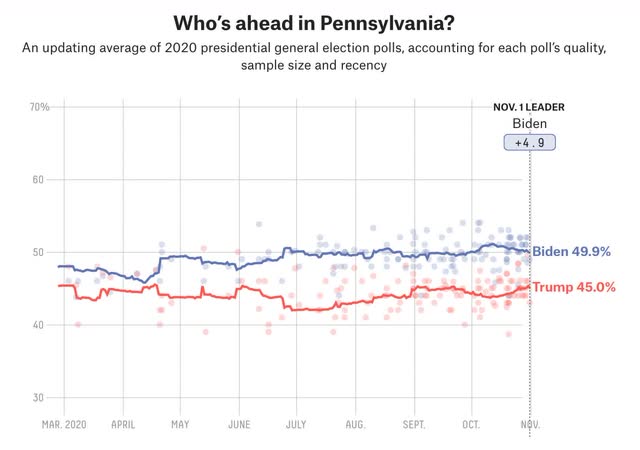 Biden’s lead in these States has been durable, and he has an actual majority in all but Pennsylvania. In short, this year the “blue wall” is extremely likely to hold. And if it does, Trump’s chances of victory are foreclosed.
Before I close out this exercise, I want to reiterate forecasts from several other good “fundamental” models.
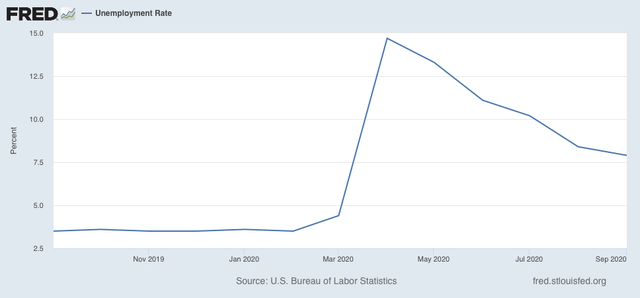
The first focuses on whether there has been an increase in the unemployment rate during the election year by more than +0.3%. Needless to say, the increase from 3.5% in February to 7.9% in September bodes ill from Trump:
Secondly, Douglas Hibbs’ “Bread and Peace” model, which relies on the Q2 and Q3 ch ange in real disposable income and then subtracts for military casualties, gives contradictory signals depending on whether or not you include pandemic fatalities as being similar to military fatalities. Here’s the model’s performance through 2016:
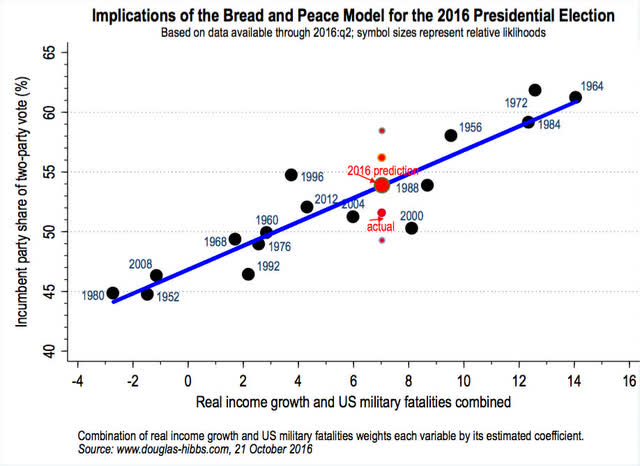
Hibbs, who is still alive, has not updated his model for 2020.
The Congressional stimulus earlier this year strongly boosted personal income. Since there have been negligible military casualties, another researcher duplicating Hibbs’ methodology recently estimated that the model would predict a roughly 52% vote share victory for Trump. But in 1952 and 1968, military casualties of roughly 35,000 out of a roughly 175 million US population subtracted 7% to 8% from the incumbent share. If one plugged the pandemic casualties adjusted for current US population, the model would subtract almost 4x that number, or roughly 30%, from Trump’s share!
Finally, my favorite “fundamentals” model takes the candidates’ Q1 polling results and a. djusts for the reading of the index of leading indicators through that point. In Q1, Biden already had a slim lead over Trump in national polls, and then the pandemic did this to the Index of Leading Indicators:
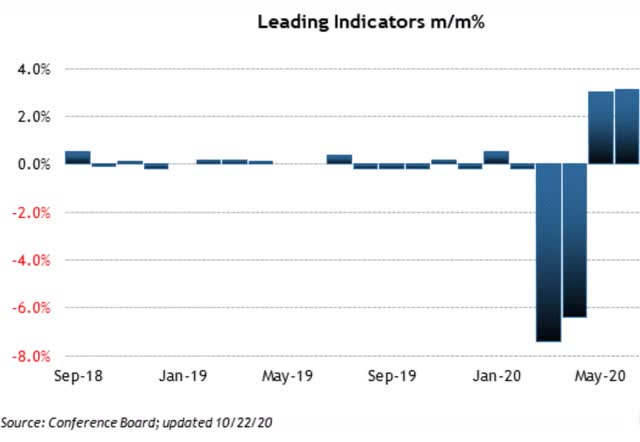
I’ve included the graph through June just for comparison purposes.
In short, the Index of Leading Indicators forecast a very dramatic drop in the economy, which did happen and from which the economy has only partially recovered. Here is Prof. Menzie Chinn’s graph of the 4 big coincident indicators through October:
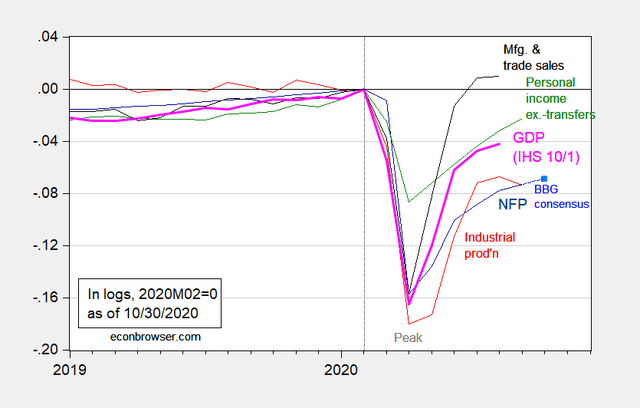
In short, with the unusual exception of one that focuses on personal disposable income, the “fundamentals” models strongly indicate a big Trump loss. Further, the model that is based no the Index of Leading Indicators foretold this over half a year ago, as I wrote here LINK.
In sum, I am increasingly confident of a Biden victory, perhaps a decisive one, with the final Electoral College tally of Biden 350, Trump 181, with 7 toss-ups.