- by New Deal democrat
Let’s take a look at yesterday morning’s JOLTS report for October. I thought I’d start off this month by stepping back and comparing the monthly change in employment from the jobs report (red) with the monthly total of hires minus total separations from the JOLTS report (blue), going all the way back to the beginning of the latter series in 2001:
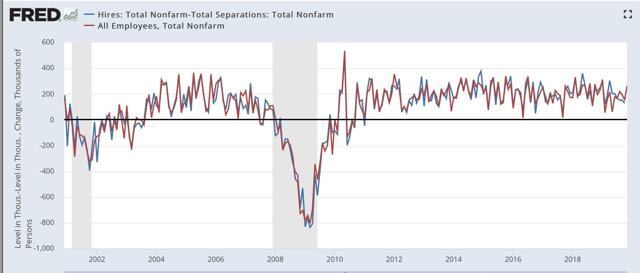
Note that the monthly changes are almost always very close.
Here is a close-up of the past few years:
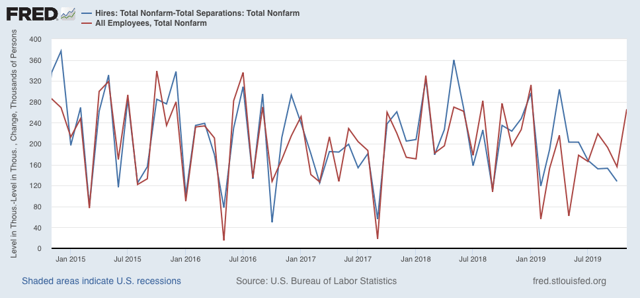
By contrast, since April of this year the series have diverged significantly. I’m not sure what the reason is, but it is something to keep an eye on.
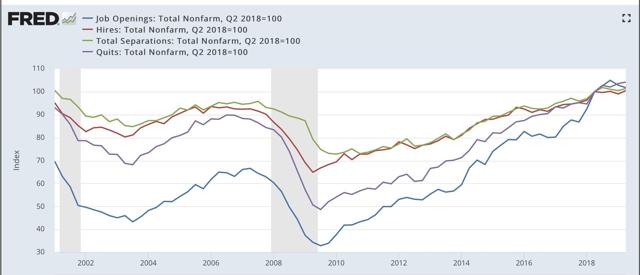
Next, let’s review the order in which the JOLTS series peaked during the 2000s expansion:
- Hires peaked first, from December 2004 through September 2005
- Quits peaked next, in September 2005
- Layoffs and Discharges peaked next, from October 2005 through September 2006
- Openings peaked last, in April 2007
as shown in the below graph (quarterly, normed to 100 as of May 2018):
Here is the close-up on the past few years (monthly), normed to 100 as of August 2018:
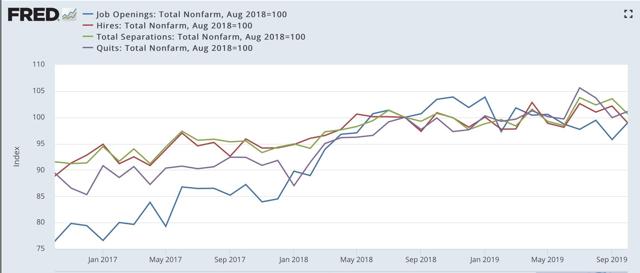
In the past 14 months, with the exception of job openings, these series have essentially gone sideways, with job openings and hires both below their levels then, and quits and separations only slightly (1.1% and 0.6%) higher, respectively.
Here is the same data tracked YoY, first quarterly since 2001:

Note that hires and total separations turned negative YoY first, in Q1 2007, followed by quotes and openings in Q3.
And now focused on the past five years:
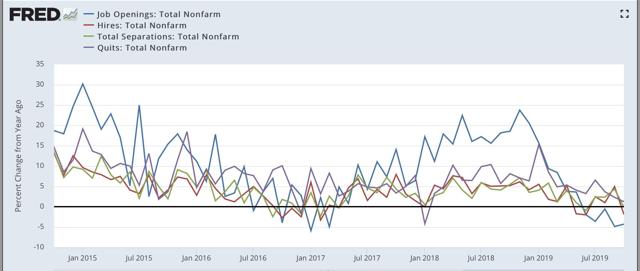
The soft patch during the shallow industrial recession of 2015-16 is evident. The current soft patch is not quite so negative.
Finally, For completeness’ sake, below are total layoffs and discharges (blue). Note that these turned up appreciably in the six months or so before the Great Recession. This month I thought I would compare them with initial jobless claims (averaged monthly, red) to compare which gives better signals of turning points:
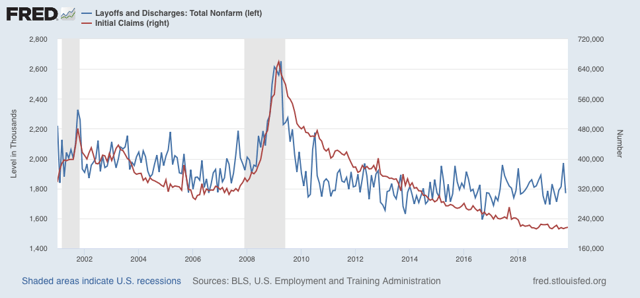
As you can see, both peaked at the same time near the end of the last two recessions, but initial claims are much less noisy in the lead-up to recessions, and so are the better indicator.
Because November’s jobs report was so strong, I am expecting a better JOLTS report next month. In the meantime, the soft patch in the employment market is evident.