- by New Deal democrat
Motor vehicle sales are a short leading indicator. In particular, on the consumer side, they have typically rolled over after housing but before consumer nondurables, so they are useful in gauging the health of the consumer.
More recently I’ve started tracking heavy truck sales as well. That’s because, in addition for being a proxy for the producer side of the economy, as the below graph shows, they are much less noisy that light vehicle sales, and susceptible to fewer false positives (note: measure is quarterly to cut down further on noise):
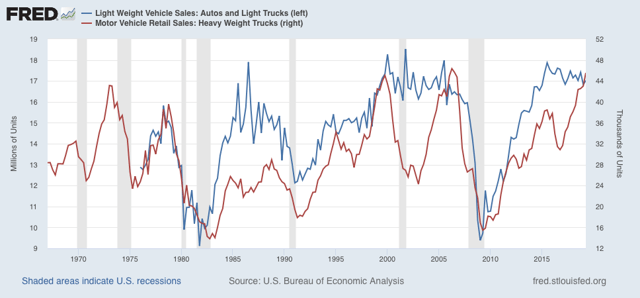
With the exception of 1969, heavy truck sales have always declined ~20% or more from peak prior to the onset of a recession. The only false positives are 1984-86, 1994-96, and 2015-16, all of which were pronounced slowdowns. As you can see, through Q2 these were growing.
Car and light truck sales have typically declined about 10% or more on a three month moving average basis before a recession hits, which would be below 16.5 million vehicles annualized, but there is lots more noise.
Zooming in on the past few years on a monthly basis, the below graphs norms September 2019’s sales levels (not yet shown on FRED) to 100:
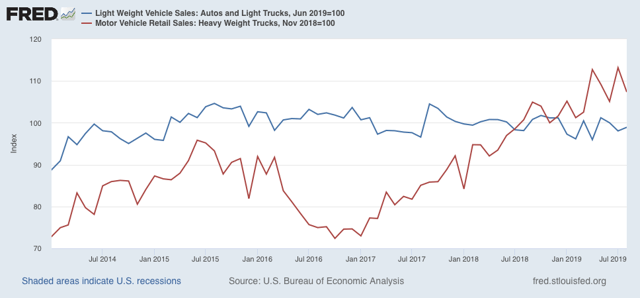
In September, 17.2 million light vehicles were sold on an annualized basis, down only about 5% from peak. But 41,800 heavy trucks were sold, a -11.6% decline from July’s record high.
Only one month, and not nearly enough to warrant any imminent recession concerns. But it’s worth noting that the one other time that truck sales declined sharply before auto sales was in the year prior to the 2001 producer-led recession. If heavy truck sales should fall by -15% or more, which would be to the 40,200 or fewer monthly, that would be a yellow flag. For now, considering the contraction shown in the ISM manufacturing index, heavy truck sales bear watching more closely.