- by New Deal democrat
I have started to monitor initial jobless claims to see if there are any signs of stress.
My two thresholds are:
1. If the four week average on claims is more than 10% above its expansion low.
2. If the YoY% change in the monthly average turns higher.
Here’s this week’s update, plus implications for the impending June jobs report.
My two thresholds are:
1. If the four week average on claims is more than 10% above its expansion low.
2. If the YoY% change in the monthly average turns higher.
Here’s this week’s update, plus implications for the impending June jobs report.
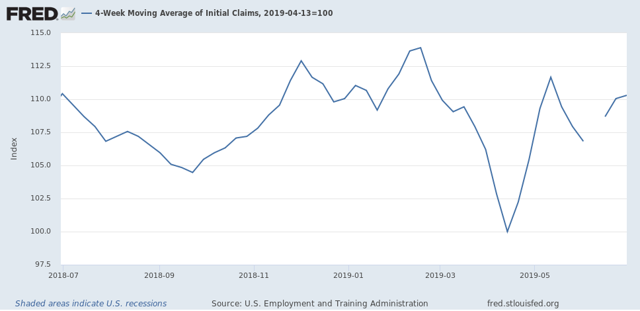
As of this week, the four week average is now 10.3% above its recent low:
Last June the monthly average was 222,000. This year it was 221,500:
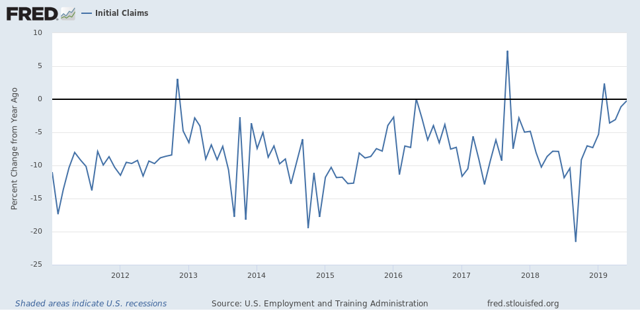
That is merely -0.2% better than last year. In other words, had this week’s number been just 1,000 higher,that would have been enough to tip this indicator from positive to neutral.
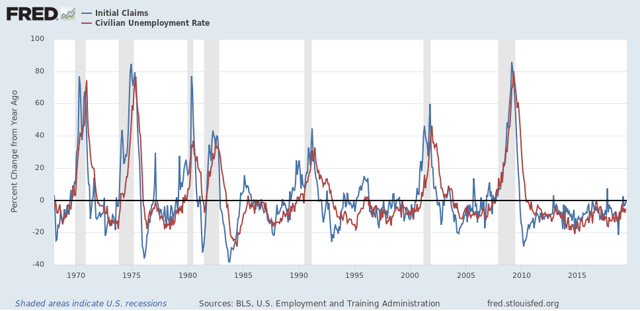
Now let’s turn to implications for Friday’s jobs report. Since initial jobless claims lead the unemployment rate, here is the long term view of both as YoY% changes going back 50 years:
Now here is the close-up on the past 8 years:
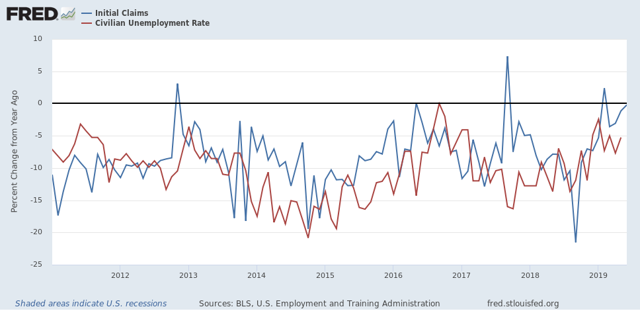
As you can see, there is no monthly correspondence, but there is a clear leading relationship. In both May and June, initial claims were barely below where they had been in May and June 2018. The corresponding unemployment rates were 3.8% and 4.0%, respectively. As a result, I am anticipating that the unemployment rate will rise to the 3.7% to 3.9% range.
Another leading employment sector is residential construction employment. As the below graph shows, it follows residential construction spending on a YoY% basis:
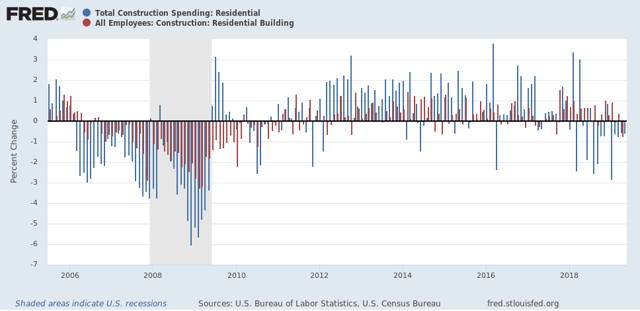
Residential construction employment declined last month, and it is most likely that it will show another decline this month.
Additionally, the leading sector of manufacturing employment tends to follow the ISM manufacturing index with a lag of 3 to 9 months. Although FRED no long er carries the ISM data, it fell below 50 in both 2011 and 2015. As the below graph shows, manufacturing employment subsequently underwent monthly declines as well:
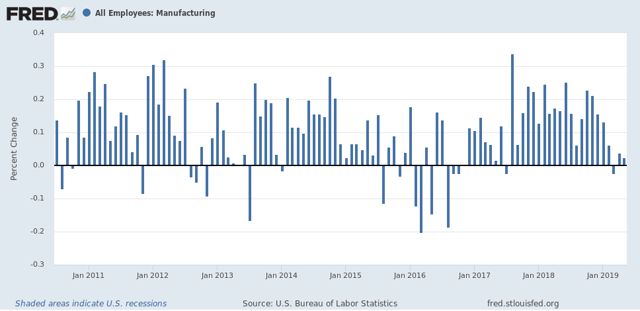
Thus I am expecting another lackluster month for this sector.
Finally, here is the YoY graph from the American Staffing Association of temporary employment:
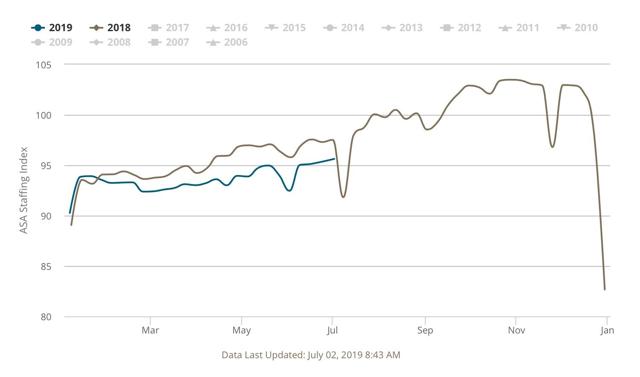
This has stopped deteriorating on a YoY basis, and has made a little bit of improvement. Thus I expect a weakly positive number for this sector.
Keep in mind that there is, as I said above, no simple month-to-month correspondence in these numbers, although on a longer term time frame it is clear.
But put together initial claims, residential construction, ISM manufacturing, and temporary staffing, and this suggests to me a middling type of number, probably between 120,000 and 160,000.
We’ll see Friday.