- by New Deal democrat
The jobs report one month ago was a blowout to the upside, so I expected the JOLTS report for April, reported yesterday with a one month lag, to follow suit. And generally it did.
Because this series is only 20 years old, we only have one full business cycle to compare. During the 2000s expansion:
- Hires peaked first, from December 2004 through September 2005
- Quits peaked next, in September 2005
- Layoffs and Discharges peaked next, from October 2005 through September 2006
- Openings peaked last, in April 2007
In yesterday’s report:
- Hires made a new expansion high
- Quits were only 1000 off their expansion high
- Layoffs and discharges backed off from interim lows in January and March
- Openings continued to fade from their expansion high last November:
Here’s the composite graph (with layoffs and discharges inverted, since fewer is better):
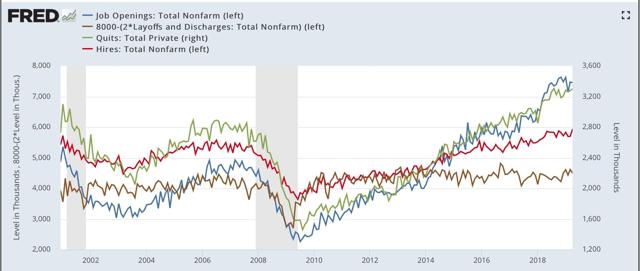
And here are the YoY% changes, better to show the underlying trend (minus hires, which I’ll break out separately below:

You can see that openings are weak, and quits actually went negative, while layoffs have improved from a year ago.
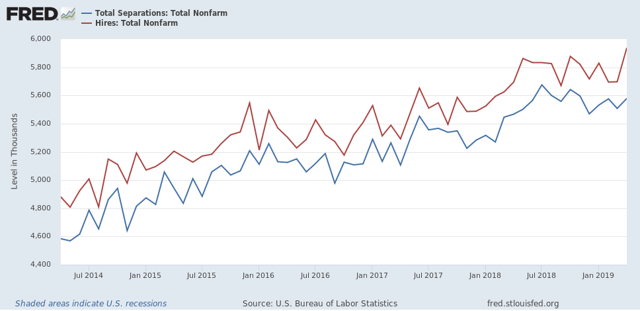
Next, here is the update of the “hiring leads firing (actually, total separations)” metric:
And here is the same data measured as a YoY% change:
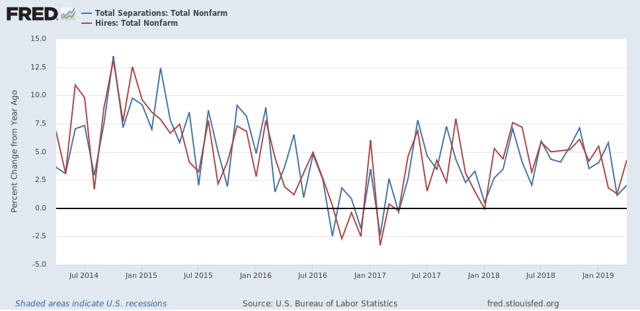
Hires bounced back strongly in April, while total separations continue to show weakness but are not negative.
To sum up, this was a strong report, on par with the strong April jobs report, with hiring and quits consistent with a strong employment picture, while other metrics showed varying degrees of weakness, but no impending doom. The report may also have been affected by residual seasonality due to the very late Easter. If so, there will be payback one month from now.