- by New Deal democrat
This morning the 10 year vs. 3 month interest rate spread inverted again:
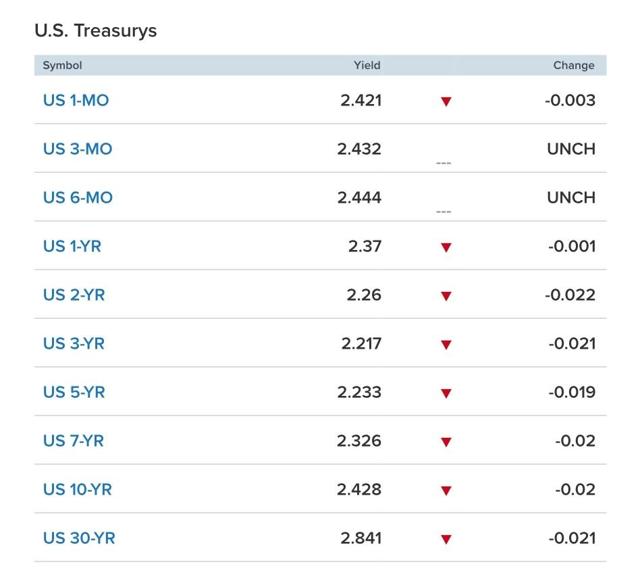
With the exception of the 30 year and spreads between 5 and 30 years, the entirety of the yield curve has inverted. And don’t forget, the intermediate term 2 year through 5 year spread has been inverted for nearly half a year!
Here’s a long-term view of the 10 year minus 3 month spread:
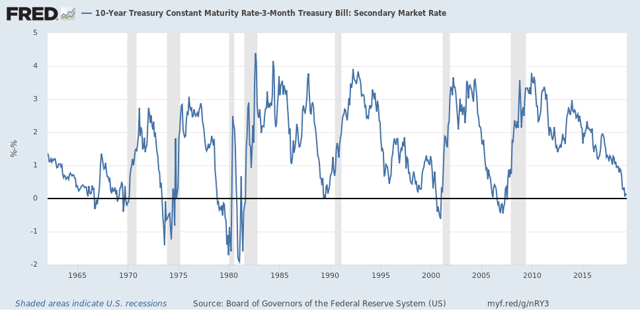
Here’s the thing: no matter which yield curve measure you choose, you still have to deal with the fact that it inverted in 1966 and 1998 (doesn’t show up in the above graph because it was only for a few days), and no recession followed within 24 months, although in the former case there was a substantial slowdown.
But since the inversion is because the 10 year has fallen so much, it is putting a bottom under the housing market. As of yesterday, mortgage rates have fallen back to 4.20%:
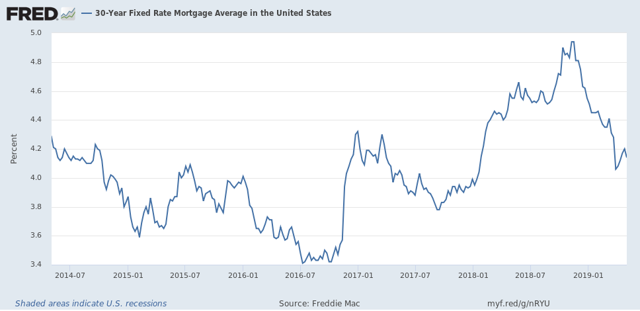
Mortgage applications are picking up again. This morning’s report shows them up 5% YoY. And that renewed housing activity should filter through into the wider economy by next year.
Bottom line: either the yield curve or the housing market are giving a false signal.