- by New Deal democrat
The JOLTS report on labor is noteworthy and helpful because it breaks down the jobs market into a more granular look at hiring, firing, and voluntary quits. Its drawback is that the data only goes back less than 20 years, so from the point of view of looking at the economic cycle, it has to be taken with a large dose of salt.
With that disclaimer out of the way, Tuesday’s JOLTS report for December was mixed, and for the second month in a row was soft relative to the strength of the overall jobs gain for that month. With the exception of one new high, the other series are off their best levels, and two continued to decline, with the good news being that there were generally positive revisions in the previous month’s data:
- Quits declined for the 4th month in a row, and are about 5% off peak.
- Hires rose and are only 0.3% off their peak set two months ago.
- Total separations declined and are off 4% from August.
- Job openings made a new all time high.
- Layoffs and Discharges declined (a good thing), but remain up about 10% from their recent low last March.
Let's update where the report might tell us we are in the cycle.
First, below is a graph, averaged quarterly through the fourth quarter, of the *rates* of hiring, quits, layoffs, and openings as a percentage of the labor force since the inception of the series (layoffs and discharges are inverted at the 3% level, so that higher readings show fewer layoffs than normal, and lower readings show more):
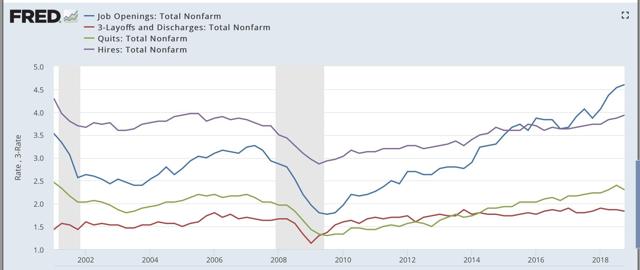
During the 2000s expansion:
- Hires peaked first, from December 2004 through September 2005
- Quits peaked next, in September 2005
- Layoffs and Discharges peaked next, from October 2005 through September 2006
- Openings peaked last, in Spril 2007
By contrast during and after the last recession:
- Layoffs and Discharges troughed first, from January through April 2009
- Hiring troughed next, in March and June 2009
- Openings troughed next, in August 2009
- Quits troughed last, in August 2009 and again in February 2010
Now here's what the four metrics look like on a monthly basis for the last five years:
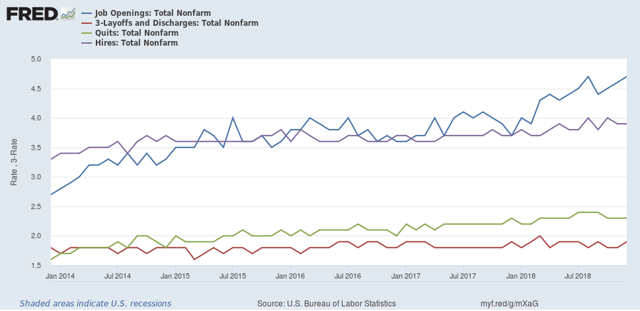
As indicated above, job openings, quits, and hires all surged higher through August of this year. While openings have continued to rise, hires have gone sideways, and quits have deteriorated.
.
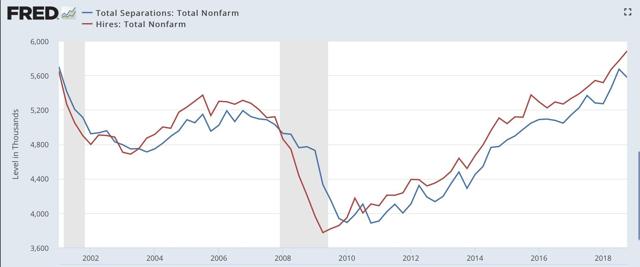
Next, here's an update to the simple metric of "hiring leads firing," (actually, "total separations"). Here's the long term relationship since 2000 through Q4 of 2018:
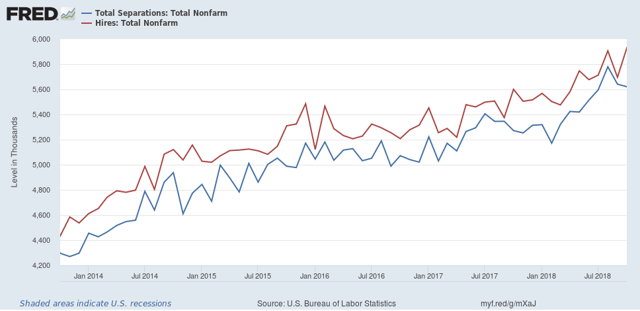
Here is the monthly update for the past fiv e years:
In the 2000s business cycle, hiring and then firing both turned down well in advance of the recession. With the positive revisions, there is no significant downturn shown here.
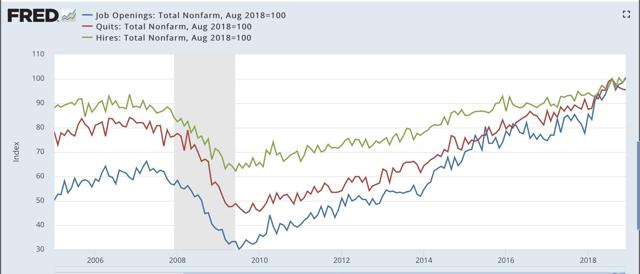
Finally, let's compare job openings with actual hires and quits. As you probably recall, I am not a fan of job openings as "hard data." They can reflect trolling for resumes, and presumably reflect a desire to hire at the wage the employer prefers. In the below graph, the *rate* of each activity is normed to 100 at its August 2018 value:
Now, here is a close-up of the last two years:
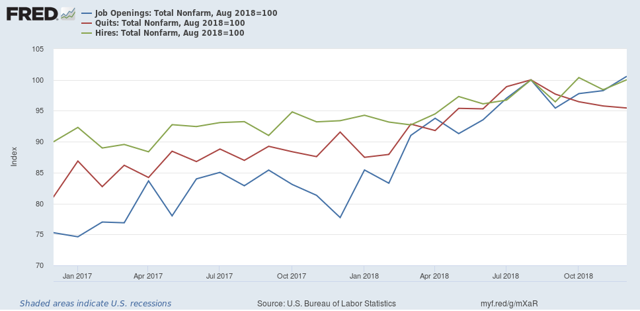
When I first presented this graph, I noted that while the rate of job openings was at an all time high, but the rate of actual hires has only just reached its normal rate during the several best years of the 2000s expansion, and was below its rate at the end of the 1990s expansion. With the positive revisions, that story has completely changed, as all three rates are better than their best rates in the 2000s expansion.
In 2018, both hires and quits accelerated, with hiring decisively above its level from the last expansion. My take has been that employees have reacted to the employer taboo against raising wages by quitting at high rates to seek better jobs elsewhere. Last month I wrote, “If the dam is finally breaking, we should see the hiring rate increase, and quit rate level off.” Although similar, instead hires have leveled off, while quits have declined.
In summary, the December JOLTS report was generally strong. As I expected it to be given the headline jobs number, but had soft spots. My expectation remains that this will start to cool down during the first six months of this year as a slowdown begins to take hold. but this won’t happen as long as the headline numbers remain so strong, as they were agiain in January.