- by New Deal democrat
The jobs and wages of average Americans is a major focus of my blogging, since they are a major component of Americans' well-being.
Recently I've written quite a bit about the labor force participation rate, especially about prime age individuals. In addition to the big secular influx of women into the workplace between roughly the mid-1960s into the early 1990s, there has been an almost remarkably steady slow decline averaging about -0.3% a year in prime age male participation, going all the way back to the 1950s!
A major element of the participation rate is comparison with other alternatives to being in the labor force.
Two alternatives to labor participation appear to have had a significant effect on the rate.
First, the cost of child care, which has soared over the last 15 years, compared with subdued (or paltry) wage growth has caused many women and some men as well in the prime age demographic to leave the labor force completely and instead raise their children as homemakers.
A second alternative, which appears to be a major determinant of the decline in male participation at least over the last 60 years is the expansion of disability insurance. This increase in disability has been mainly due to neck and back conditions, and together with improved longevity, has increased the incidence of long-term disability dramatically.
It has also been suggested that the huge increase in the incarceration rate from roughly 1980 through 2000 has also played an important role in depressing participation.
In several posts over the last week, I've suggested that the traditional Phillips curve which posited a relationship between lower unemployment and higher wage growth and inflation, is best seen as a special variant of a broader relationship between the labor force participation rate (i.e., the total of those both employed and unemployed). For 46 of the last 52 years it has been true under first a high inflation regime and secondly a low inflation regime that an increase in labor force participation has been correlated with more wage growth.
But on a secular basis, the correlation does not reflect direct causation. Rather, increased labor force participation (blue in the graphs below) appears to lead an improvement in wage growth (red) by about one year. Here's the high-inflation, high labor bargaining power 1960s and 1970s:

and there is the low inflation, low bargaining power era since 1988:

In both of these eras, generally participation led wage growth by about one year.
For completeness purposes, here is the transitional Reagan Administration:
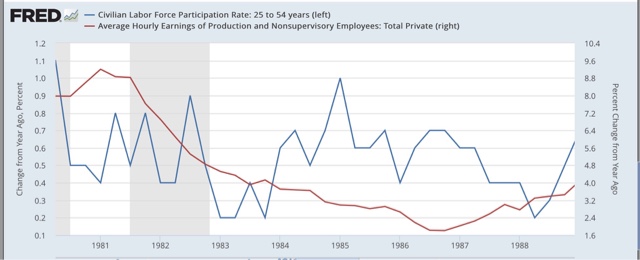
In this transition period, labor bargaining power was curtailed sharply as was inflation. Even so, the leading/lagging relationship appears intact, as lower participation led lower wage growth by about a year.
A more nuanced cyclical feedback mechanism appears to be that too rapid an increase in participation will lead either to higher inflation (the 1960s and 1970s) or lower short term wage growth (the 1980s to present. To show that, below is a variation on the misery index. The "misery index" came out of the 1970s and added the inflation rate to the unemployment rate. In the graph below, I have double-weighted inflation. the only major departures between this "misery index" and labor force participation are the Oil shocks of 1974, 1979, 1990, and 2008:

Let me wrap up this compendium on labor force participation by applying this to our present situation. In the last 1 1/2 years, there has been one of the two biggest surges in participation in the last 30 years, meaning that wage growth has stalled out:

If this increase in the labor force is successfully absorbed into the economy, improved wage growth ought to resume as early as later this year.