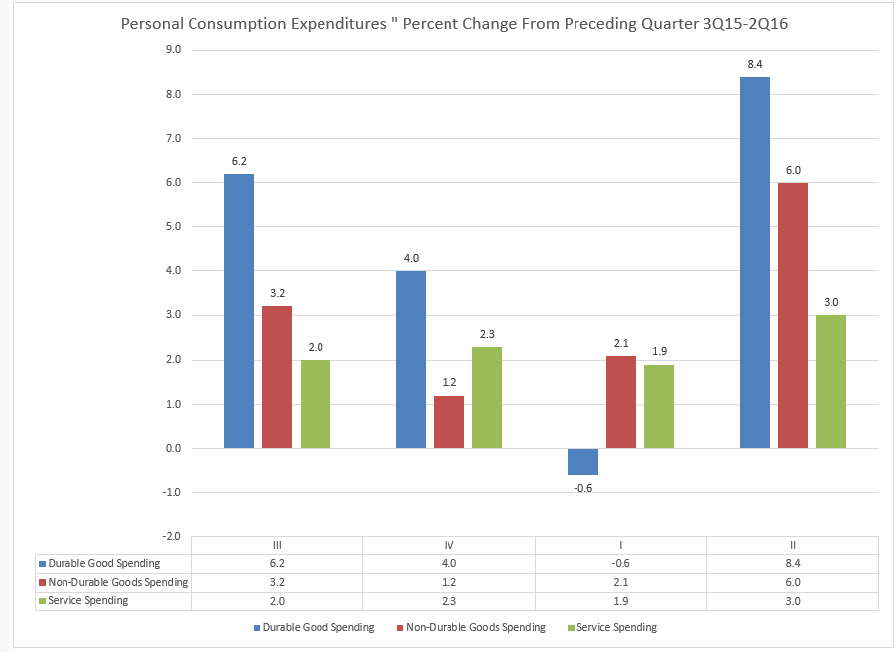
All three categories of spending -- durable goods, non-durable goods and services -- increased at their strongest Q/Q pace in 4 quarters. This is confirmed be the last few real retail sales figures:

In contrast, business investment declined at the sharpest rate in 4 quarters:

Why is this happening? The oil market slowdown is a primary contributor:

Mining production (which includes oil extraction) declined 21% in the last year, which is bound to have a negative impact on equipment investment (the red bar 2 graphs up) .
Non-residential structural investment (blue line above) has declined in 6 of the last 8 quarters. I haven't found a good explanation for this, although this graph of capacity utilization may provide part of the answer:

Overall utilization has been declining since the mid-1990s; it has peaked at lower levels for each of the last 2 expansion. If an economy is using fewer real estate resources, it needs less real estate. This also ties into the secular stagnation theory, part of which states that a knowledge/technology-based economy needs fewer real estate resources, leading to a lower amount of physical investment.
Interestingly enough, residential investment (the purple bar above), which had been a strong contributor to growth, declined M/M as well. This is the first drop for this category since the 1Q14. It does make more sense which you consider that housing starts and building permits have moved sideways for the last year or so:

It's doubtful we'll see a strong pick-up in non-residential structural investment due to the low rate of capacity utilization and shift towards an intellectual capital economy. However, since the start of the year oil has rebounded in price, implying we've at least seen a bottom in the pace of equipment investment. And the housing market continues to grow: existing home sales just hit a 9-year high and the new home market is very tight:

The above graph plots new home sales (red line, left scale) and the months of supply of new homes (blue line, right scale). It shows that while new home sales have been increasing since 2011, the months of supply have been holding steady. While this is positive for prices (and new home builder profits) it may eventually lead to a shortage. Ultimately, this means we have a higher probability of additional residential investment, reversing this quarter's contraction.
Ultimately, it's looking more and more like the U.S. economy has shifted into a lower but ultimately steady pace of growth.