- by New Deal democrat
As most readers know Bill McBride a/k/a Calculated Risk and I have a charitable bet about the direction of housing in 2014.
In his forecast for 2014 residential investment, CR said, "I expect growth for new home sales and housing starts in the 20% range in 2014 compared to 2013."
By contrast, several months ago, in a post at XE.com, I said that "If the typical past pattern is followed, we will shortly see permits running 100,000 less than one year previously."
By contrast, several months ago, in a post at XE.com, I said that "If the typical past pattern is followed, we will shortly see permits running 100,000 less than one year previously."
Here are the terms of our bet: If starts or sales are up at least 20% YoY in any month in 2014, I will make a $100 donation to the charity of Bill's choice, which he has designated as the Memorial Fund in honor of his late co-blogger, Tanta. If housing permits or starts are down 100,000 YoY at least once in 2014, he make a $100 donation to the charity of my choice, which is the Alzheimer's Association.
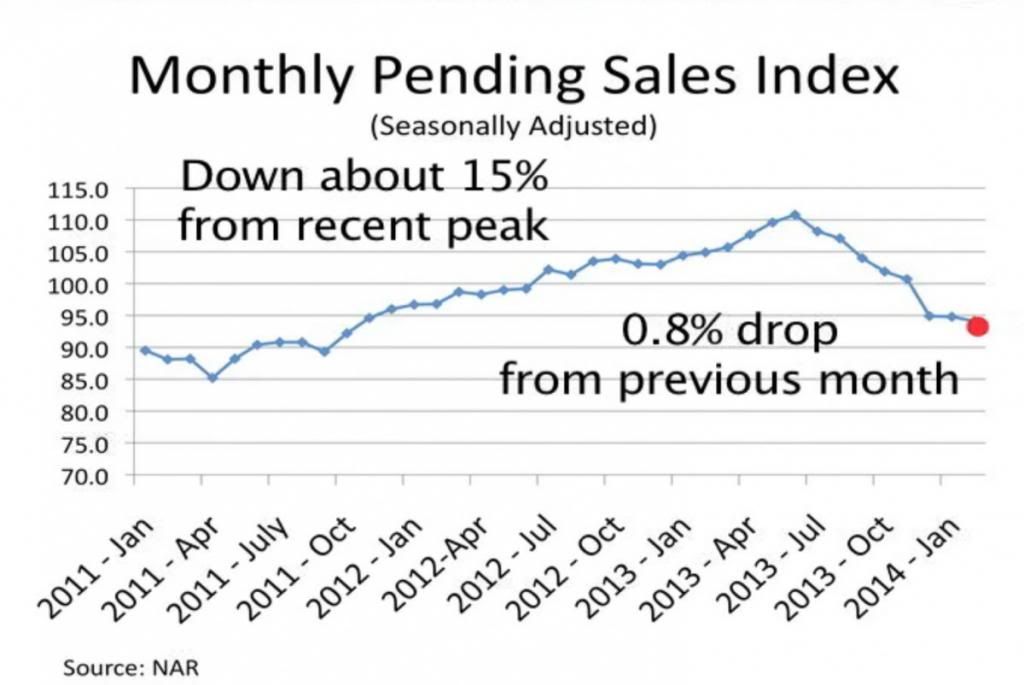
This morning the final monthly report on housing for February, pending home sales, was reported by the NAR. The index was down -0.8% m/m from January, but down -10.2% YoY, and in fact was the lowest reading in over 2 years:
This morning the final monthly report on housing for February, pending home sales, was reported by the NAR. The index was down -0.8% m/m from January, but down -10.2% YoY, and in fact was the lowest reading in over 2 years:
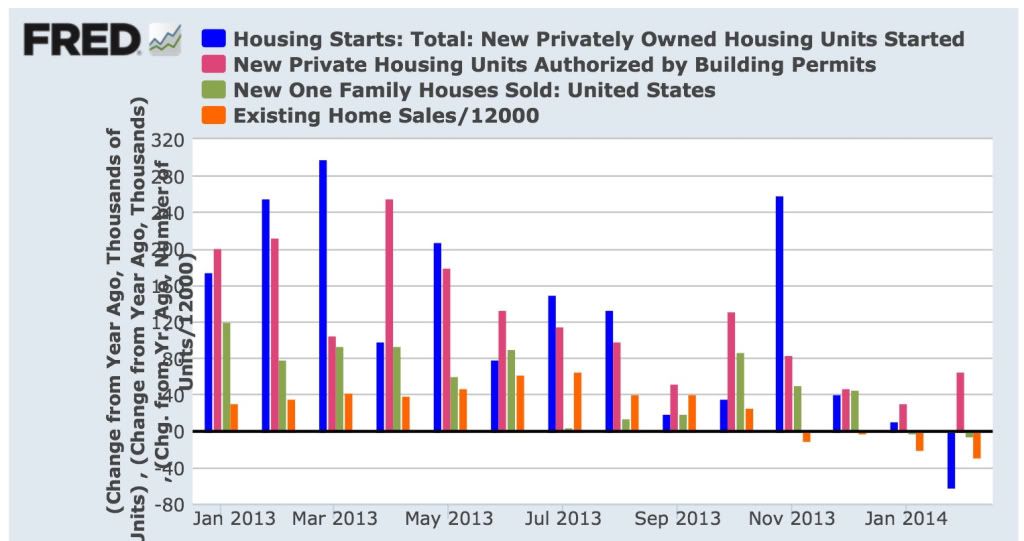
First, here is a graph of the change, in thousands, YoY of starts (blue), permits (red), new home sales (green), and existing home sales (orange) (note that the St. Louis FRED does not track pending home sales):
Next, here is the YoY% change in the same four statistics:
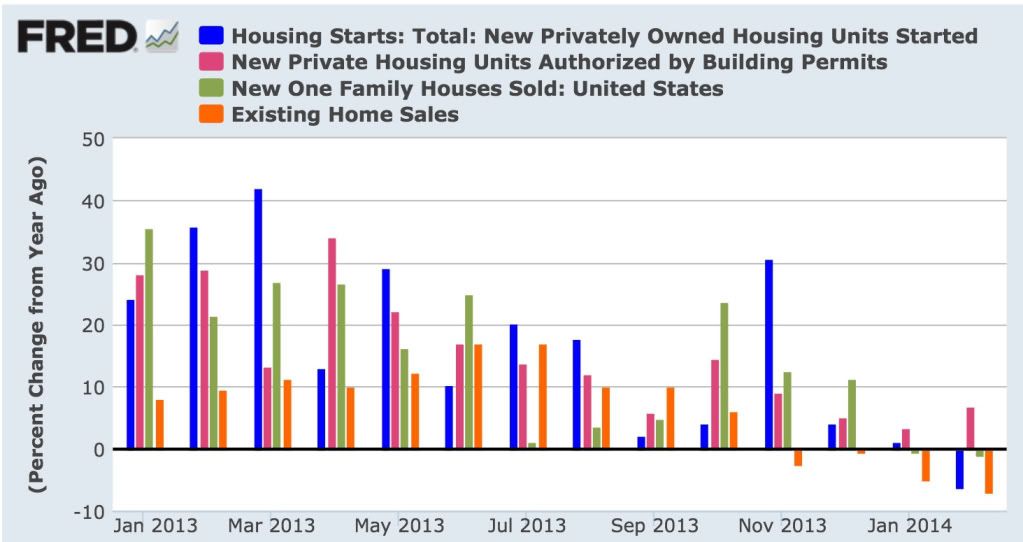
Both of these graphs show the clear deceleration in the housing market through 2013 and further into February 2014, to the point where 4 of the 5 monthly reports have turned negative YoY. The strongest metric is housing permits, which rebounded slightly from a +3.3% YoY reading in January to a +6.5% rYoY eading in February. Nevertheless, the graphs make clear that except for permits, deceleration has turned into outright YoY decline.
Bill's forecast of 20% annual growth will take a real reversal of momentum (housing starts and sales will have to be up about 25% on average YoY for the next 10 months), although there are some individual months where there are some easy YoY comparisons. Obviously I am expecting some further deterioration, concentrated between now and mid-year.
Most people seem to be either surprised by or ignoring the housing slowdown. And yet there is no doubt that the trend has turned negative as I forecast it would.