- by New Deal democrat
[Update: graphs and links now added.]
Today we will get the final employment report for 2013, and the alternative claims are already starting. For example, yesterday Naked Capitalsim is claiming that people over 65 are working more because they can't retire. Even though almost every aging Boomer will tell you that they'd like to work part time after 65 to keep mentally active and socially involved. And those who stayed the course with their 401k's since 2008 have more worth in them now than before the recession. And elderly life expectancy has improved dramatically in the last 30 years.
But the real issues are wages and the unemployment rate among working age adults.
Let me start by saying that the current rate remains unacceptably high, and Washington should have done far more (like a new WPA for infrastructure repairs, like Bonddad and I suggested four years ago!). But that doesn't excuse faulty methodology in service to a good cause.
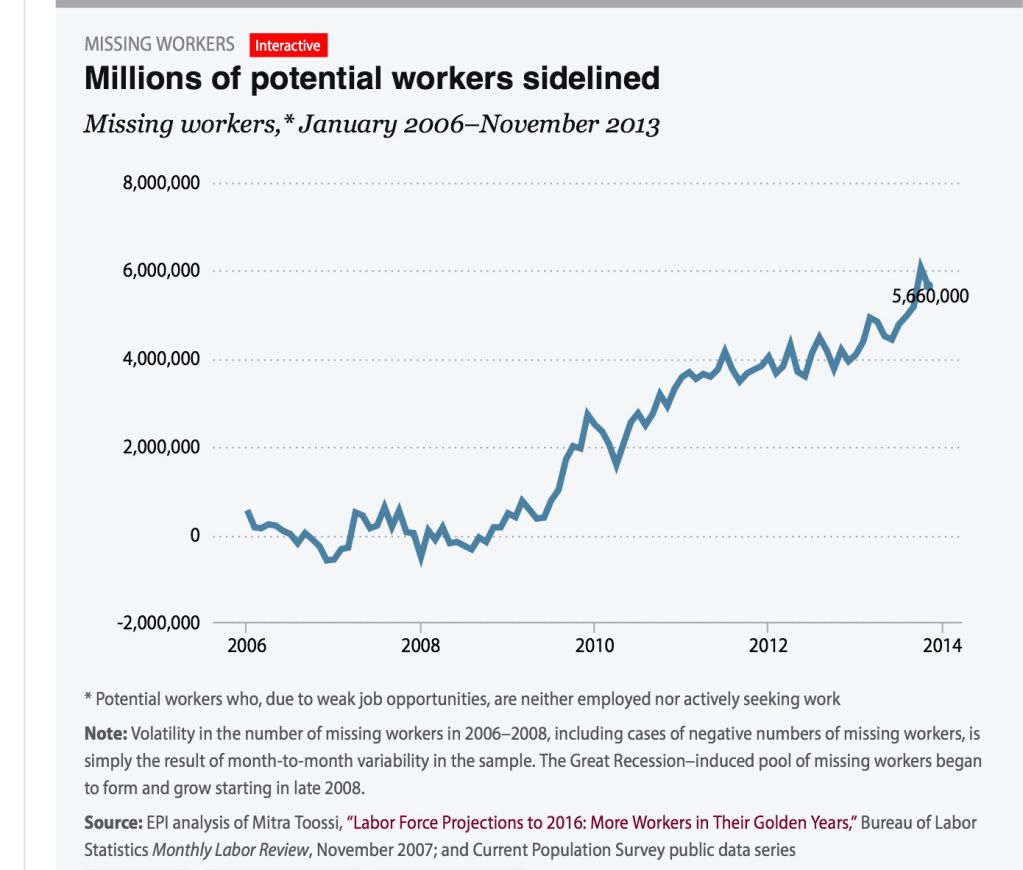
And that's what brings me to the Economic Policy Institute's "missing workers" report", which claims to measure the "real" unemployment rate.This was introduced a few months ago, and has gotten a lot of attention on progressive blogs since. It purports to show that the number of "missing workers" who want a job but have dropped out of the labor force, has continued to increase, to as high as 6 million a few months ago. Unlike virtually every other measure of the unemployment rate, it has shown virtually no improvement in the last 3 years, as shown in their accompanying graph:

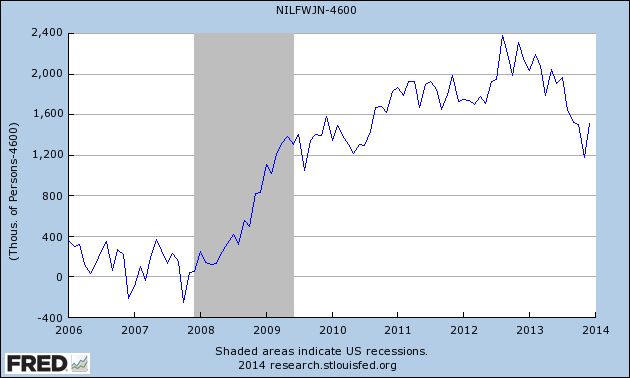
There are at least 2 major problems with their methodology. First of all, as I already described several weeks ago, the Census Bureau asks a question in the Household Survey each month designed to elicit exactly what the EPI says it is measuring; namely, those who are "Not in [the] Labor Force, [but] Want [a] Job Now," or series "NILFWJN." Even in the best of times, about 4.6 million people tell the Census Bureau that they fall into that category, as shown in the graph below where I have subtracted that number to norm it to approximately zero in 2006 and 2007, the same average number as the EPI graph [updated with this morning's information]:

Both series follow a similar trajectory through 2011, but the official Census Bureaur data never shows an increase of more than 2.4 million, and declined to 1.2 million in November, whereas EPI shows a total of 6 million in October of this year.
The second problem with the EPI's methodology is that it makes use of the less accurate, more erratic employment number from the Household Survey, rather than the Nonfarm Payrolls employment number from the BLS, which has a much larger sample size. The issue here is that, since January 2012, the payrolls report shows that almost 4 million jobs have been added to the economy. The Household survey, however, shows only 2.8 million jobs added, a deficit of 1.2 million jobs.
Almost everyone concedes that the nonfarm payrolls employment number is more accurate. Further, most economists expect the more erratic Household Survey number of employed to resolve closer to the trend in the Payrolls report. Ordinarily, that's not a problem.
But because the EPI's "missing workers" methodology compares job growth against a target (projected civilian labor force from 2006), EPI essentially makes that entire 1.2 million difference part of the enhanced unemployment figure. To cut to the chase, if the EPI's report made use of the nonfarm payrolls number for employment, their alternate unemployment measure would have fallen by about an additional 1% in the last couple of years, and would be following a similar downward trajectory as virtually every other measure of unemployment.
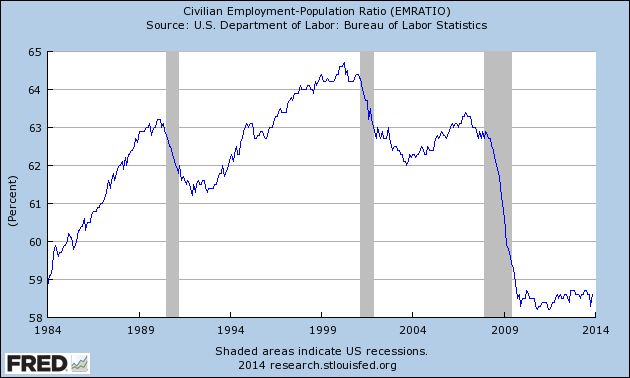
In fact, if the nonfarm payrolls reports are accurate, then EPI's measure becomes virtually impossible. That's because, as shown in blue in the graph below, the population increase for those age 16 and over since the beginning of 2010, the bottom for employment in the Great Recession, is about 8 million. The Payrolls report shows 7 million jobs added, or about 87.5% of the entire working age population increase.
For so long as the statistics have been kept, the biggest percentage of the population age 16 and over that has been employed is about 64.5%, which applied to 8 million is 5.2 million:

In other words, even under the most pessimistic scenario that can be concocted using the nonfarm payrolls number, the entire working age population plus about 2.0 million people have found jobs in the last 4 years, and 92% of the 4.3 million growth sonce January 2012, or about 1.2 million more thn the most pessimistic employment to populatioin reading. that is a -0.8% decline in the unemployment rate even before we take into account retiring Boomers, just in the last 22 months. But the EPI measure only reigsters a decline of -0.3%, including retiring Boomers.
Put another way, if the nonfarm payrolls numbers have been correct, the number of total unemployed including those so discouraged they stopped looking for owrk should have decreased by several million since the beginning of 2012.. And yet the EPI measure has the total number of missing unemployed workers rises almost relentlessly throughout that period, almost completely offsetting the number of officially unemployed workers. That's not just wrong, if the nonfarm payrolls report is correct, it's impossible.
Maybe EPI has good explanations for these issues. But without more, it is difficult to see why we shouldn't just accept the official Census Bureau report of those who say they aren't looking (and so aren't in the labor force), but want a job now. The number will be updated later this morning, and I'll have an updated graph that includes that measure for both the U-3 and U-6 (part time and marginally attached workers) metrics.