- by New Deal democrat
My method of foecasting is pretty simple. In fact, so simple, I call it the K.I.S.S. method. Even though the LEI is the statistic most denigrated by Wall Street forecasters, it has the inconvenient habit of being right more often than the highly-paid punditocracy, especially at turning points.
Since I'm not a highly paid Wall Street pundit, I simply rely upon the LEI for the short term, and the yield curve for the longer term with the caveat of watching out for deflation. The simple fact is, with one exception, if real M1, and real M2 (less 2.5%), are positive, and the yield curve 12 months ago was positive, the economy has always been in expansion. When real money supply is negative, and the yield curve was inverted 12 months ago, the economy has always been in contraction. The exception is that the yield curve does not help to project the economy 12-16 months later if the economy at that later date is in deflation - as it was in 1930-32 and late 2008 and early 2009.
In the few years I have also learned a lot about the methods of the late Prof. Geoffrey Moore, the founder of ECRI, so I also intergrate his findings about short and long leading indicators into my forecast.
This year the forecast methods are consistent for the first 6 months: growth will continue. It is in the last half of the year, and particularly in the 4th quarter, that there is more difficulty.
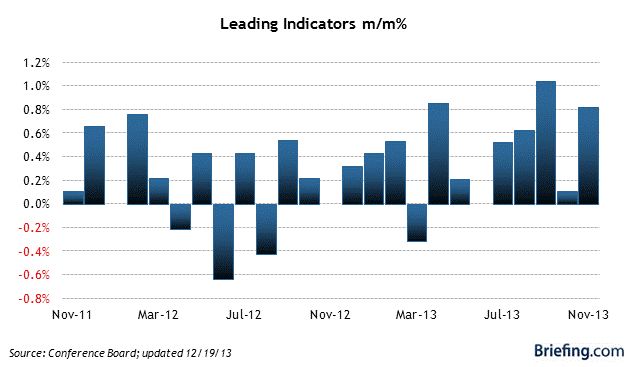
First of all, let’s look at two overlapping but different forecast algorithms with a time frame of approximately 6 months ahead: the Conference Board’s Index of Leading Indicators, and ECRI’s Weekly Leading Index.
Here is a graph of the LEI via Briefing.com
And here is ECRI’s WLI via Doug Short:
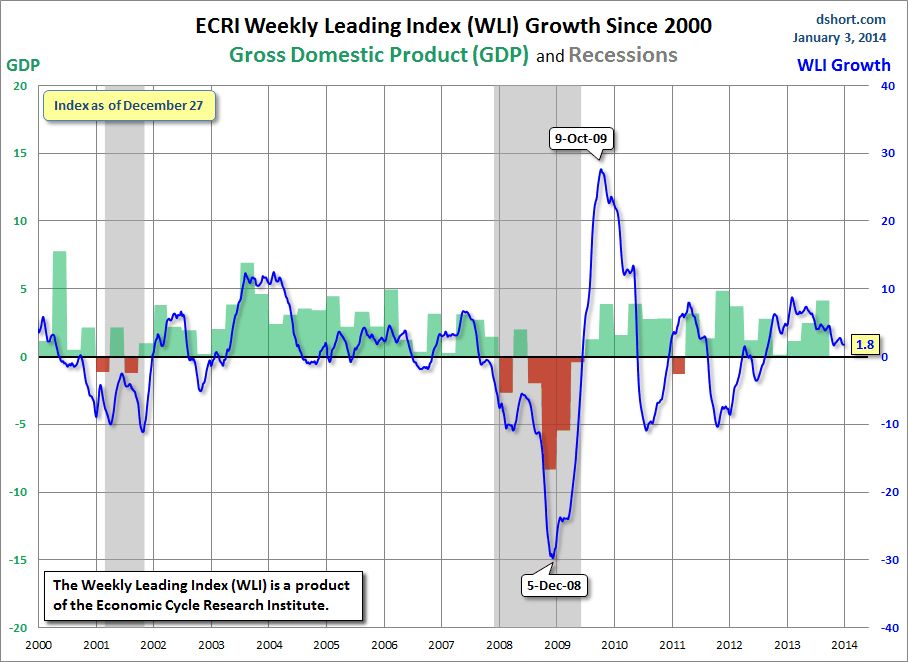
Both of these are forecasting continued growth over the next 6 months. In fact, the LEI has actually picked up strength in the last several months.
One big difference between the two measures is that the LEI uses housing permits and starts (actually a long indicator) as a component, while the WLI uses the Mortgage Bankers’ Association’s purchase mortgage application index as a component. After sideways movement for most of the year, housing permits unexpectedly rose strongly in October, and maintained that level in November. On the other hand, purchase mortgage activity has made new post-recession lows due to the increases in interest rates.
One other item worth noting is that there does not appear to be any big surge in gas prices (outside of the seasonal norm) forecast, so inflation should be kept in check, so there should be no “oil price shock” to the economy. Also, it appears that Washington
But the LEI and the WLI do not forecast more than about 8 months out. For that we need to look at the long leading indicators. There are two separate ways I look at this. First, when the yield curve and real money supply as measured by M1 and M2 are positive (+2.5% in the case of M2), the economy has always expanded one year later (provided there is no deflation), including during the pre-WW2 era that may be more applicable to today’s economy. By contrast, when both measures are negative, a recession has always ensued.
First of all, here is the yield curve, as measured by 10 year treasury rates minus 6 month treasury rates:
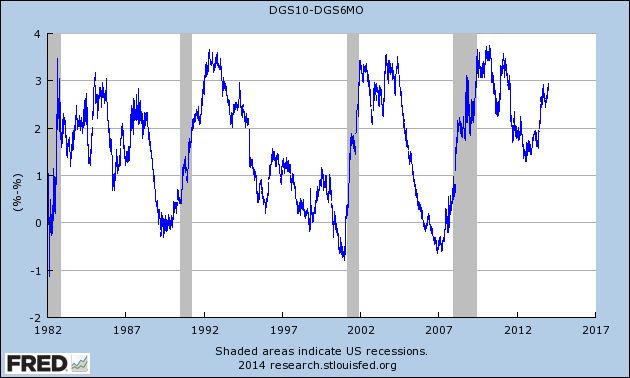
Note that these reliably inverted (i.e., the result was negative) a year or more before the onset of each of the last three recessions (and the same is true of prior post-WW2 recessions). As you can easily see, the yield curve has steepened considerably in the last 8 months, entirely due to the increase in yields for the 10 year Treasury note. Provided we do not expect deflation in the final part of this year, this should mean clear sailing.
Now let’s take a look at the 4 long leading indicators identified by Professor Geoffrey Moore and at least until recently, the components of ECRI’s “long leading index.” These are: corporate bond yields, inverted (blue), housing permits (red), corporate profits (green), and Real M2 (orange):
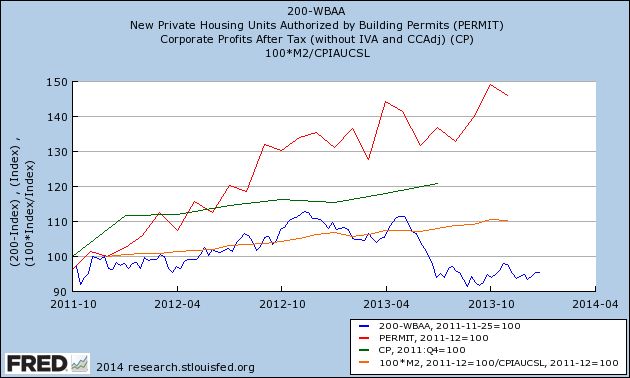
Three of the 4 of thee indicators are absolutely positive, but at the same time all 4 have decelerated, as highlighted in this next graph, which measures the YoY% change in the same items:
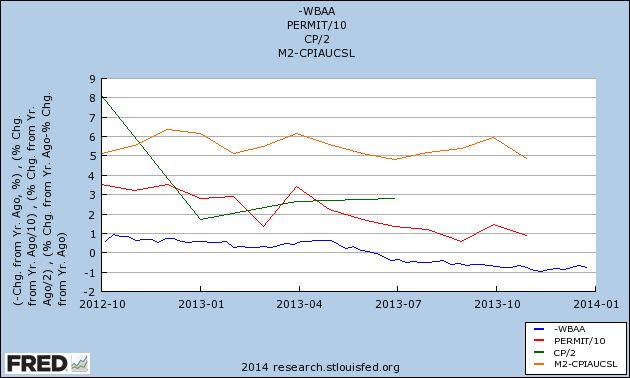
Interest rates for corporate bonds have increased, meaning that indicator has turned negative. If present trends continue, and based on the last 50 years of history, the odds are extremely good that they will, housing permits will turn negative at some point in the first half of this year. Similarly, if their current trend continues, real M2 will also fall below +2.5% (although I emphasize that I have no data helpful as to whether M2 will or won’t). Corporate profits are a total question mark, although we will begin to get an answer as Q4 earnings are reported over the next month or so.
Finally, here is a look at Real M1:
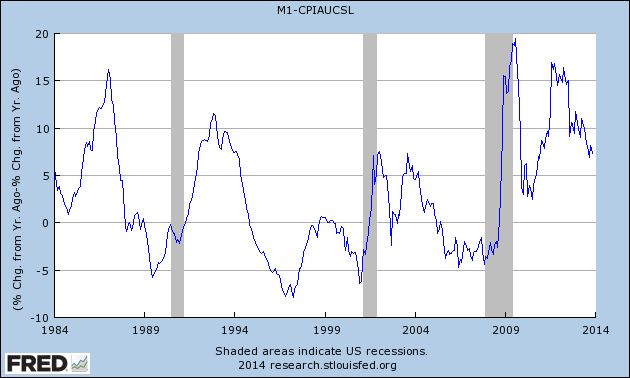
This too has been decelerating, although it remains very positive.
In conclusion, unless we expect deflation (and right now I don’t), there is every reason to view the long leading indicators, under either method, as being in agreement that the economic expansion will continue through the end of 2014.
On the other hand, the deceleration of most of the indicators, and also the deceleration of the WLI, cause me to believe that the second half will be considerably weaker than the first half. If the long leading indicators turn negative quickly enough and significantly enough, it is possible that we could enter into a recession in Q4. Before ruling that out, I want to see how 2013 Q4 corporate profits play out, as well as the next couple of months of housing and money supply data. But subject to that caveat – that there are mounting reasons to be concerned about 2015 – I look for continued positive readings in employment, wages, industrial production, and GDP through the year.
I can’t help noting that my contrast for decelerating growth is at odds with that of many luminaries, including Paul Krugman, Bill McBride a/k/a Calculated Risk, Muhammed el-Arian of PIMCO, and Menzie Chinn of Econbrowser. Morgan Stanley went so far as to call the economy “ready for launch.”
My critique of these optimistic calls is what I laid out at the outset of this article: all of these forecasts, to a greater or lesser extent, engage in coincident-trend-following. Morgan Stanley’s note, for example, cites the coincident indicator of freight transportation, as well as the short leading indicators of the ISM survey and capex spending. Several others take similar tacks.
And although I have great respect for both Bill McBride and, of course, Krgthulu, both of them rely on an acceleration of the housing recovery. For example, Krugman says, “housing is still moving forward.”
I always caution against using the present progressive tense without extreme care when it comes to economic data. What we know is that housing permits and starts made new highs in October, although permits pulled back slightly in November. We also know that the trend in 2013 was of decelerating growth, as I’ve set forth above. And nearly every other measure of housing, except for prices, has taken it on the chin. In addition to purchase mortgage applications, pending sales just went negative YoY.
I always caution against using the present progressive tense without extreme care when it comes to economic data. What we know is that housing permits and starts made new highs in October, although permits pulled back slightly in November. We also know that the trend in 2013 was of decelerating growth, as I’ve set forth above. And nearly every other measure of housing, except for prices, has taken it on the chin. In addition to purchase mortgage applications, pending sales just went negative YoY.
So, just as I was an outlier to the chorus of Doom beginning at the end of April 2009, I am afraid I am going to have to withhold my cheers now. My forecast is that 2014 will be a year of decelerating growth.