- by New Deal democrat
My method of foecasting is pretty simple. In fact, so simple, I call it the K.I.S.S. method. Even though the LEI is the statistic most denigrated by Wall Street forecasters, it has the inconvenient habit of being right more often than the highly-paid punditocracy, especially at turning points.
Since I'm not a highly paid Wall Street pundit, I simply rely upon the LEI for the short term, and the yield curve for the longer term with the caveat of watching out for deflation. The simple fact is, with one exception, if real M1, and real M2 (less 2.5%), are positive, and the yield curve 12 months ago was positive, the economy has always been in expansion. When real money supply is negative, and the yield curve was inverted 12 months ago, the economy has always been in contraction. The exception is that the yield curve does not help to project the economy 12-16 months later if the economy at that later date is in deflation - as it was in 1930-32 and late 2008 and early 2009.
Since in the last couple of years I have also learned a lot about the methods of the late Prof. Geoffrey Moore, the founder of ECRI, I've also been able to intergrate his findings about short and long leading indicators into my forecast.
This year, the LEI, the yield curve, and the short and long leading indicators of Prof. Moore are in close agreement: they suggest that, for the next 3 to 6 months, the economy will continue to shamble along just barely avoiding recession. Thereafter all of the long leading indicators are suggesting further improvement. But as we saw in late summer 2012, an unexpected Oil price spike can complicate the picture. And the embrace of austerity as enacted by last week's "fiscal cliff" agreement also throws a monkey wrench into the forecast.
Let's take each of those items in order.
For the first half of 2013, the economy will shamble along basically sideways.
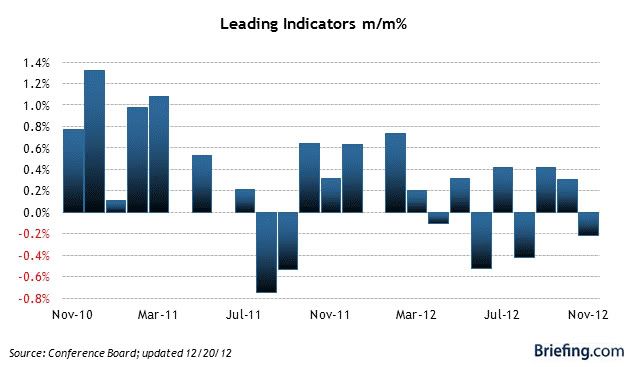
Here is a chart, from Briefing.com, of the monthly change in the LEI for the last two years:

Notice that in March 2012, the positive bias downshifted markedly. In fact, for the last 6 months through November, the index did not advance at all. Since a significant downdraft in November was the spike in inital jobless claims post-Sandy that completely reversed itself in December, we can expect a similar rebound in the LEI for December when it is released in a couple of weeks. This suggests an economy that is moving forward, but with very little momentum.
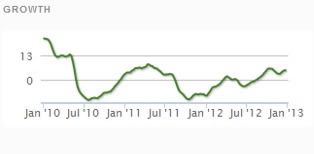
ECRI's Weekly Leading Index, which is also supposed to be a short, 6 to 8 month leading index, suggests the same shambling forward - which is no surprise, since it contains many of the same components. More specifically, it consists of initial jobless claims, the JoC ECRI commodity index, purchase mortgage applications, commercial vs. treasury yield spreads, real M2 money supply, stock prices, and corporate bond yields. Here is ECRI's latest publicly available graph of its WLI growth index:

Six to twelve months ago this index was generally negative to neutral. It is only in the second half of 2012 that it began to improve and then turn positive for the last three months. Additionally, several short leading indicators that only appear monthly, and are therefore not in the WLI - namely, new factory orders and ISM backlog of deliveries and inventory readings - are at recessionary readings. This index actually suggests deterioration in the economy in the next three months or so before stabilization by midyear.
We can also take note of the Oil choke collar in this analysis. It appears that gas prices bottomed in December 2012 at the identical price they were in 2011. It is reasonable to expect that the Oil choke collar will engage by spring and remain engaged, with gas quite likely hitting $4 a gallon by summer.
So is the balance tipped towards expansion or contraction in the first part of the year? With housing permits and car sales hitting new post-recession highs, with the S&P 500 index having just made a new 4 year high, and with initial jobless claims hitting new 4+ year lows, the answer should be an easy "NO!" None of these things has ever been consistent with a recession.
But Congress and President Obama just threw a monkey wrench into the works, in the form of a 2% payroll tax increase on the first $110,000 of income. The fact is, in order to maintain the long-term solvency of the Social Security Trust Fund, that increase (really just the ending of a temporary cut) was necessary. But for the health of the economy, without any offsetting relief on consumers, a new and significant drag has been added to consumer spending.
And it is consumer spending via refinancing which has been keeping the economy treading water for many months now. Frankly, I expect to see a significant pullback in consumer spending as a result of the decrease in disposable income within the next 3 months. Unless a further opportunity to refinance at even lower interest rates appears, that may be enough to tip us into a short term contraction at some point in the first 6 months of this year, specifically including one or more months of actual job losses beginning in March or April.
Contractionary fiscal policy is, after all, contractionary.
(continued in part 2)