- by New Deal democrat
For three years beginning in late spring 2009, the data justified optimism about the economy. That all changed with the very weak March 2012 employment report. Unlike the double dip scares of 2010 and 2011, this year first the leading indicators have moved generally sideways rather than improving, and now the coincident indicators are following suit. Note that I'm not saying that the economy is contracting, but rather that it is shambling along like a fighter who is out on his feet, or a drunk standing on the sidewalk.
My reason for caution now is the same as my reason for optimism in late spring 2009. While pundits charge hundreds of millions of dollars for attempting to look into the crystal ball, the K.I.S.S. method is simply to track the index of Leading Economic Indicators kept formerly by the BEA and for the last 15+ years by the Conference Board. You may not always be right, but you'll be right a lot more than some very well paid well known pundits.
A little background: the index is the fruit of a lifetime of work by Prof. Geoffrey Moore. In the 1980s, funded by the federal government, revisions were proposed which were implemented in the 1990s. At the same time, Prof. Moore founded ECRI. The BEA also sold the rights to the public LEI to the Conference Board. Since then, both ECRI and the Conference Board have made further refinements. The difference is that ECRI's information is almost all hidden in a black box (except for the WLI, which interestingly has been contradicting their public statements), whereas the LEI is public and transparent.
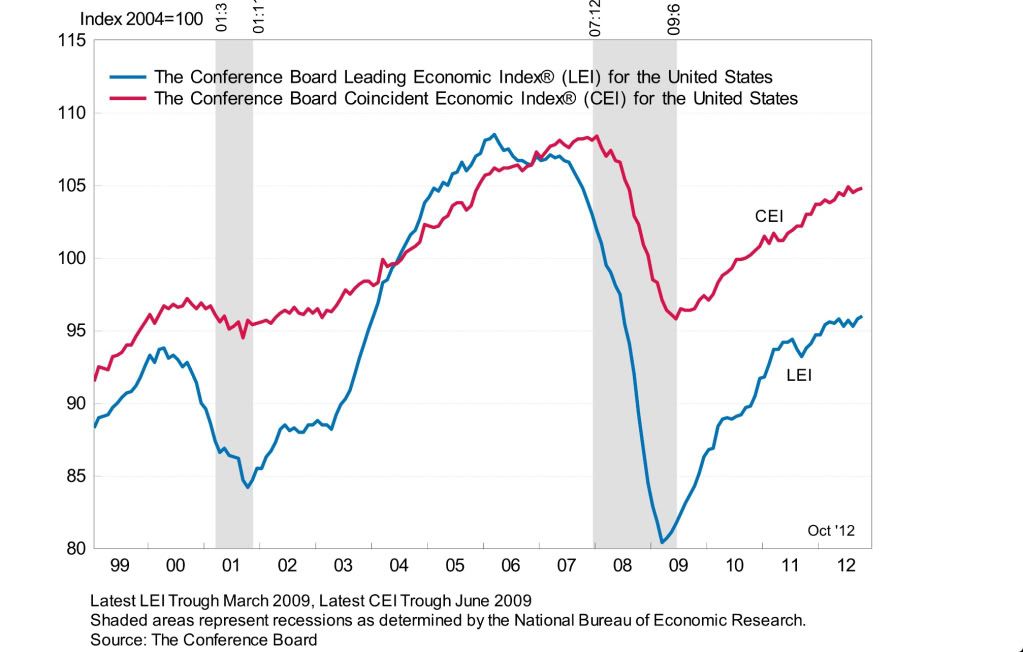
So, without further ado, here is a graph of the LEI through October 2012:
 ]
]
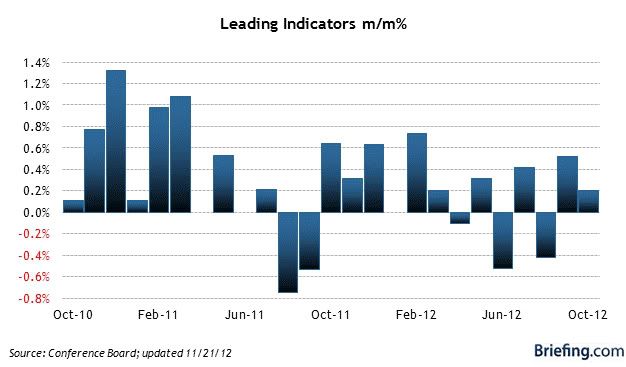
Note that the LEI, after advancing pretty much relentlessly since a few months before the end of the last recession, hiccuped in summer of 2011 and has pretty much stalled this year. Here is a close-up of the last 24 months' values:
The index is still generally advancing, but just barely.
There are several heuristics for determining for much of a decline in the LEI is significant enough to signal recession. The first is declines for three months in a row. As the close-up above shows, we've avoided that so far this year although twice on a three month rolling basis the average has been negative.
A second heuristic is that a recession begins when at least 8 of the 10 indicators are lower than where they were 6 months ago.
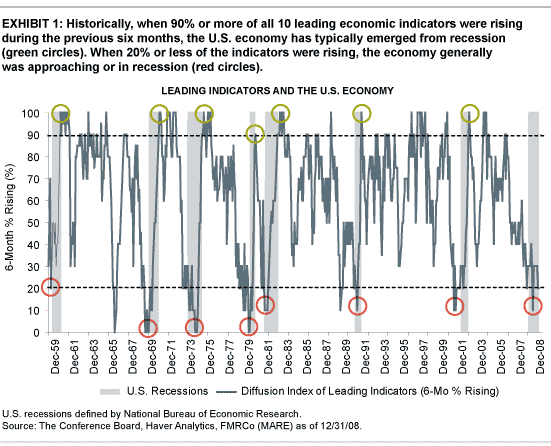
To that end, here is a screen shot of the values of the 10 indicators since April 2012 from the Conference Board's website:
.JPG)
As of October, the 6 circled series out of the 10 total were lower than their values 6 months ago. Only initial jobless claims, the stock market, building permits, and the expectations component of consumer confidence readings are at better readings than they were back in April.
So the bottom line is, the simplest reliable method of looking at the economy tells us that we aren't in a recession now, and may not be in one for the next few months at least, but on the other hand it couild lurch forward, come to a complete standstill, or enter a real contraction more or less randomly, and fairly quickly to boot. I intend to flesh this out in my next few posts.