- by New Deal democrat
The NBER defines a recession as a pronounced downturn in production, sales, employment, and income. Although the last three years have by no means been good times for Joe and Jane Sixpack, the fact remains that employment and real income did turn up, and made new post-recession highs as of their last report.
Although, as per the weekly reports of same store sales and Gallup's conumser spending I post each Saturday, the YoY percentage increase in sales has remained positive, the fact remains that YoY data must be used with consideration that it will lag turning points as compared with seasonally adjusted monthly data. And the seasonally adjusted monthly sales data has generally been flat this year.
Monthly sales can be measured three ways: real retail sales, personal consumption expenditures, and manufacturing and trade sales. ECRI focused several defenses of its recession call one year ago on a downturn in the last of these. So let's look at where each stands as of the last report. The graph below shows real retail sales (red), PCE's (blue), and manufacturing and trade sales (green, right scale):
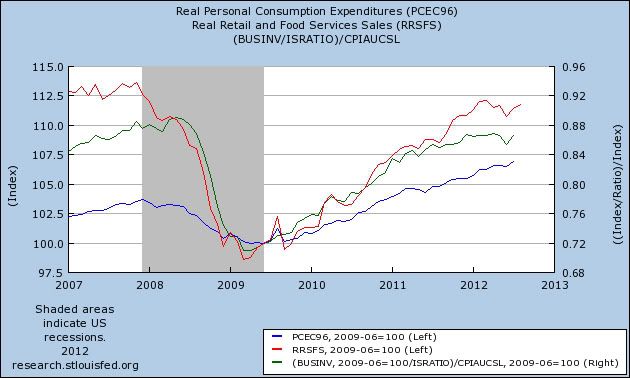
Note that only real PCE's have continued to make new highs. Real retail sales peaked in March and declined significantly until rebounding - but not to a new high - last month (they are still -0.3% below that peak). The comparison here is actually positive, since PCE's tend to decline faster going into a recession than retail sales.
Lakshman Achuthan has indicated that manufacturing and trade sales are ECRI's preferred metric. In the graph above, you can see that they appeared to peak in December of last year, but then made a slightly higher peak in May. They are -0.2% off that peak as of now.
The lack of growth in sales in the last half year is not such a downturn that necessarily means recession. At the same time, it is definitely a concern, since sales lead employment, and more particularly real retail sales (blue below, left scale) are a very good leading indicator for payrolls (red, right scale), as to which here is the most recent comparison:
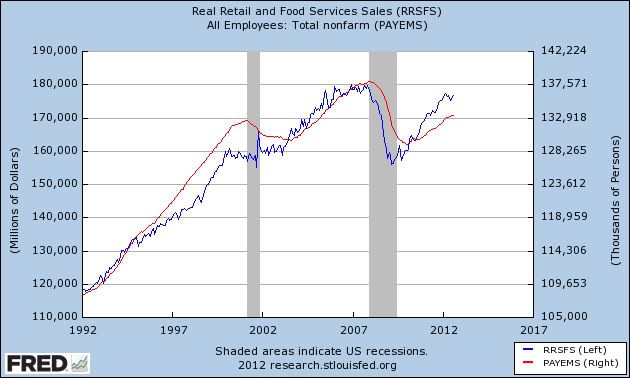
Note that the blue line (real retail sales) always changes direction before the red line (nonfarm payrolls). An actual negative print in one of the two payrolls reports before the November election is a distinct possibility, and is one of the few things that could change the dynamic of that election profoundly.