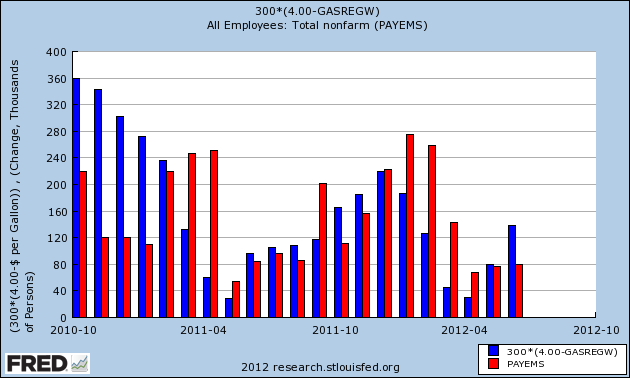
It looks like the idea that new seasonal distortions have been introduced into jobless claims and payroll data since the Great Recession, making 1st quarter numbers better, and 2nd quarter numbers worse, has some merit. I wonder, however, if the force behind that new distortion might be the Oil choke collar.
For the last 2+ years, the price of Oil has oscillated around the point where it significantly constricts economic growth. When growth takes off, Oil goes over $100/barrel. This chokes off growth, which causes Oil to retreat to under $80/barrel. This in turn releases consumer spending into the broader economy, which tries to attain escape velocity. Which causes Oil to go back over $100/barrel.
It turns out that, for the last several years, the price of a gallon of gasoline, with about a one month lag, correlates well with the monthly employment report. For every $.10 the price of gas is less than $4.00 a gallon, 10,000 jobs are added to the economy the next month. Here's the graph:

Of course, these are very limited data points, and correlation does not mean causation. In fact it only seems to be valid near the inflection point between expansion and contraction. Note the bars at the left, and also note that during the latter part and just after the Great Recession, cheap gas correlated with horrible jobs reports - but probably was part and parcel of why those reports got "less worse" at the end of the recesson. In any event, the hypothesis that it is the Oil choke collar behind the new seasonal distortions in the data certainly seems to have some merit.