ECRI's Lakshman Achuthan made the rounds of the business TV shows last week once again reiterating their call that a recession has already begun or else will begin within the next next month and a half. Curiously missing form those appearances -- as well as his numerous other appearances over the last few months -- was any detailed discussion of what ECRI's leading indicators, especially its long leading indicators, currently forecast. Virtually all of the discussion has been of coincident indicators, and indeed coincident indicators measured on a (lagging) YoY basis rather than their real monthly values.
I do not believe the omission of their leading indexes is an accident. More on that below, but first let's look at the latest evidence cited in favor of imminent recession.
In all of his appearances Achuthan cited three measures -- real personal income, real final sales, and payrolls -- out of the four that typically define expansions vs. recessons. Let's look at them first.
Here is a graph of real personal income YoY since the end of the 2001 recession. Achuthan points out, accurately, that it is lower than it has been at the start of most prior recessions:
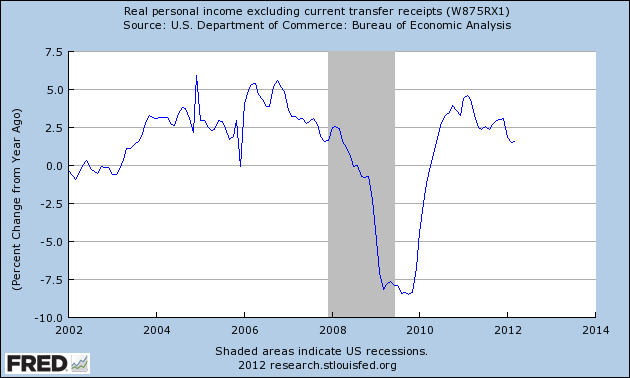
What he didn't say was that it is also at levels seen throughout 2002 and into 2003, and also briefly in 2006, when no recession occurred. In fact, in none of the times when this level has preceded recessions have households been refinancing debt at lower amounts as they have been doing quite robustly for many months now - but exactly as they were in 2002. Further, while payroll growth YoY declined slightly in the last couple of months, income turned slightly up YoY last month.
It is unclear which measure of sales the NBER uses in their determinations. The St. Louis FRED measures real retail sales in their "tracking the economy" series, as opposed to manufacturers and trade sales(h/t thiazole). In the following graph I've plotted both YoY real retail sales (in blue) and manufacturers and trade sales (in red):
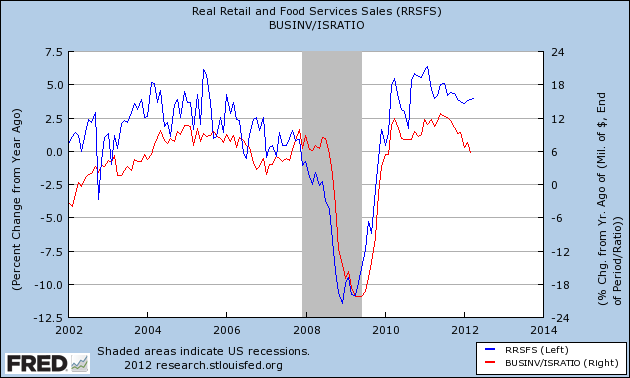
Again, it is clearly correct that manufacturers and trade sales have declined YoY quite substantially in the last year -- to a level that is equal to the YoY they held during most of the last expansion (and indeed during much of the 1990s expansion as well). You will also note that real retail sales lead manufacturers and trade sales, and turned negative in advance of them before the last recession - very unlike what they are showing now. In fact, for the last several months YoY growth in real retail sales growth has been increasing.
It is also correct that in the last two months, nonfarm payroll growth as declining YoY (measured against March and April 2011's 250,000 readings, two of the biggest gains in 5 years):
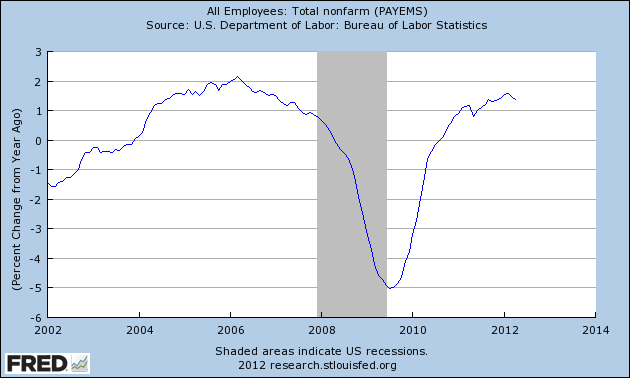
In the next two months, however, the comparisons will be with May and June 2011 which featured payroll growth of 54,000 and 84,000 respectively. If we get less than that, we won't need experts to tell us that we are in trouble, but if we get more, then YoY payroll growth is going to turn north again.
Last but by no means least, the fourth important coincident indicator of recession vs. expansion, namely industrial production, was reported yesterday. Here's a graph going back all the way to the end of the 2001 recession:
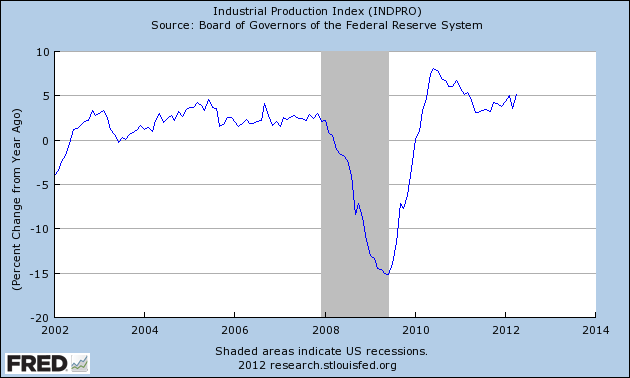
Industrial production, to put it politely, does not coincide with the notion that it is declining YoY. To the contrary, the trend for the last year has been increasingly positive YoY. In fact the 2010-2012 trend looks very similar to the 2002-04 trend coming out of the previous recession. As of right now industrial production is growing at a faster rate than at any time in the entire 2002-07 expansion.
In summary, two (and possibly three) of the coincident measures of recession, measured YoY for growth, are increasing, not decreasing.
But what I really wanted to point out here is that while ECRI has been pounding the table about coincident indicators measured YoY for the last few months, they have been almost entirely silent about their leading indicators.
ECRI's public Weekly Leading Index (WLI) is only one of at least three leading indexes that they use. Their founder, Prof. Geoffrey Moore, also proposed a Short (monthly) Leading Index and and Long Leading Index. Up until late 2009, their Long Leading Index (LLI) was also freely available at their site (and a google search will quickly turn up many graphs of the LLI). But the LLI has disappeared into the black box for the last 2 1/2 years.
ECRI certainly is not afraid to mention the direction of their LLI when it suits them. When ECRI made their recession call in September 2011, they were vociferous that their LLI had been declining since "before the Arab spring." In fact, since Prof. Moore published the components of the LLI in his 1992 book, we can look to see what the components of the LLI have been doing for the last 2+ years. Here they are, normed to 100 for easy comparison of their bottoms:
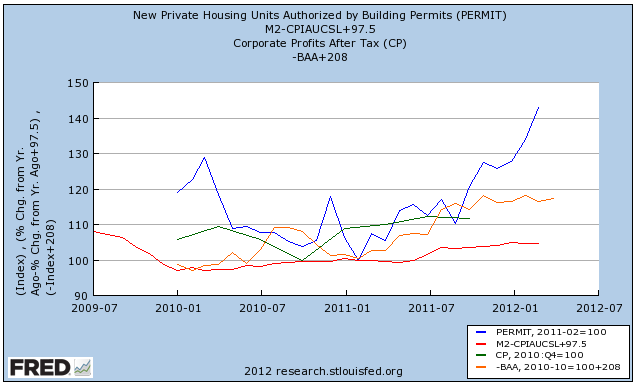
As you can see, housing permits, YoY Real M2, corporate bond yields (inverted), and corporate profits all hit soft spots at the end of 2010 into the first half of 2011 -- and all have rebounded thereafter:
The decline of the LLI into early 2011 was actually quite similar to their decline in the year 2000:

Aside from which component declined the most (bonds in 1999 vs. housing permits in 2010), the other big difference in the two periods is that it was two years before the LLI rebounded to prior levels after falling in 2000, whereas in 2011 it took only about a year, with all of the components moving significantly higher in the third quarter.
Whereas I read these indicators as foretelling a slowdown in the first half of this year, with a 2001 style recession being the worst case scenario, followed by renewed growth in the second half, in his recent appearances Achuthan appears to have softened his call to a 2001 style recession being the most likely scenario. It's worth pointing out, however, that in the past ECRI's WLI growth index turning positive has always been contemporaneous with the end of a recession - and it did turn positive for about 5 weeks before declining to -0.1 in the last two weeks:
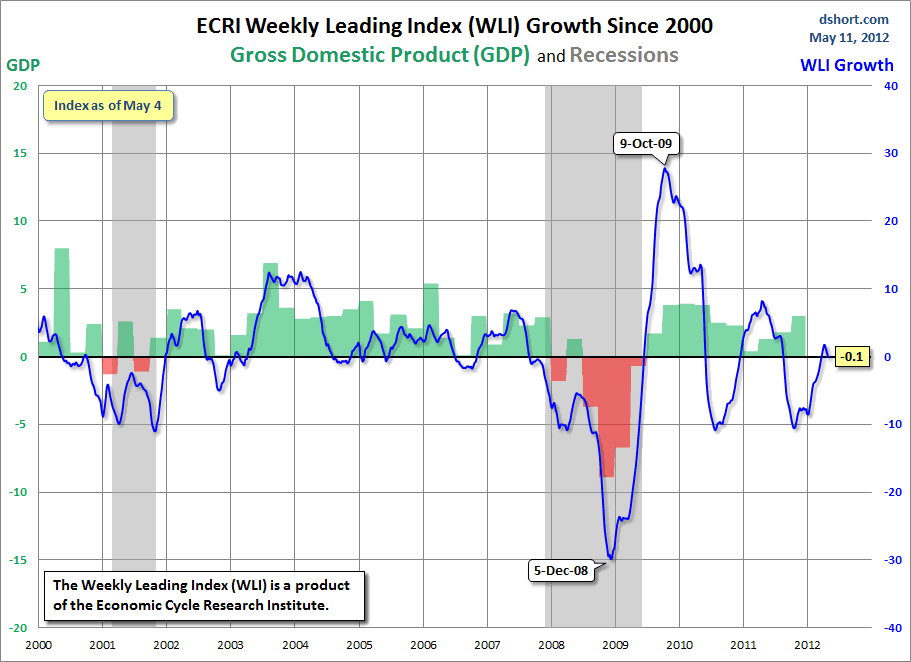
(h/t Doug Short)(As an aside, it is going to stink again this week mainly because of Europe, which has caused US treasuries to decline strongly in yield thus increasing credit spreads, and also causing commodity prices to tank - but that's another story).
So why has ECRI stopped mentioning their Long Leading Indicators? Perhaps because they are telegraphing growth in the latter part of the year, and ECRI is are looking for definitive confirmation from other indicators as to whether or not the recession that they see will be short-lived. By the way, in addition to the Conference Board, whose latest LEI was just released this morning, the Philadelphia Fed also maintains a Leading Index for the United States, which can be seen here. Neither one forecasts a recession starting in 2012.