- by New Deal democrat
Several commentators, notably Calculated Risk, believe that residential investment will probably increase - finally - late in 2011, thus going from a drag on the economy to a contributor to GDP growth. Since the housing bubble of the first part of last decade helped lead the economy into the "Great Recession", there has been consternation as to whether it could lead the economy out of the recession -- or at least finally contribute.
Several years ago, Prof. David Leamer helpfully noted that there was a housing bubble in the 1920s as well - that burst several years before the actual nonset of the Great Depression, and bottomed in 1933. Following up on that, I was able to find the data for "non farm housing starts" in the Statistical Abstract of the United States. I posted the results a year and a half ago in Housing during the Roaring Twenties and Great Depression. Included then was a chart that converted the equivalent housing starts to our time, by multiplying the data proportionate to the population for each year compared with our modern population of 300 million.
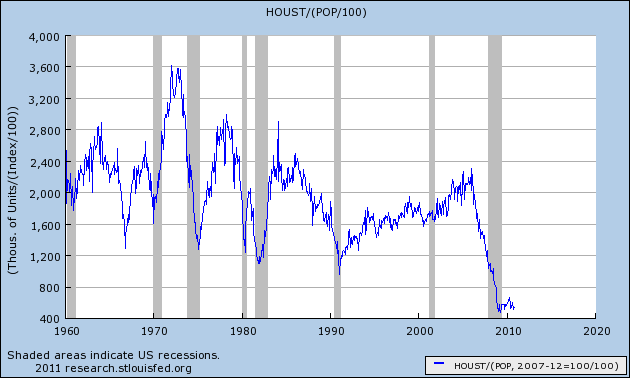
Adjusting for population makes a significant difference in how one looks at the data. Building 2 million new houses a year means something quite different in 2005 with a 300 million population, than in 1960 with a 160 million population. So adjusted, the 2000's housing bubble does not look so extreme:
Adjusting for population alone doesn't tell the whole story. There remain the issues of demographics and immigation -- in other words, one must consider the factors behind household formation. I discussed this more thoroughly here, but to summarize for this post, young people begin to move out of their parents' homes at about age 20. Those who marry very young form their own household, while young singles live with roommates. By age 25, new household formation rapidly accelerates, and continues through age 35, by which time close to the maximum percentage of people are living in their own or spouse's household.
Thus Boomer household formation coincided with the 1970's-1980's peaks, and the smaller cohort of Gen X coincides with 1990's lower numbers of housing starts. Gen Y, or the "Millenials" have already begun to form households, just as the housing bust hit.
With another year's passage of time and additional data, I am republishing the chart from my original post about housing during the Roaring Twenties and Great Depression, but I have expanded it. Not only does it adjust the 1920's figures to the current era by population, but also I am comparing the equivalent year from the Roaring Twenties and Great Depression with the last decade of housing starts, normed to the peak year, which are averaged on an annual basis to make an apples to apples comparison. All data is in 1000's:
In reviewing this chart, keep in mind that in 1930, 25% of the US population lived on farms, compared with only 2% today. Also be mindful that back then, the typical mortgage was a 5 year note that frequently included a balloon payment at the end.
The data shows that if anything, the 1920s boom was much more of a bubble than the recent one, and the ensuing eight year decline from 1925-1933 was more gradual but also sank to a lower level before bottoming.
At this point, according to recent Case-Shiller data, some housing markets are at near quarter century lows in prices. For example, here are Charlotte (green), Las Vegas (red), and Cleveland (purple) (CPI inflation in blue):
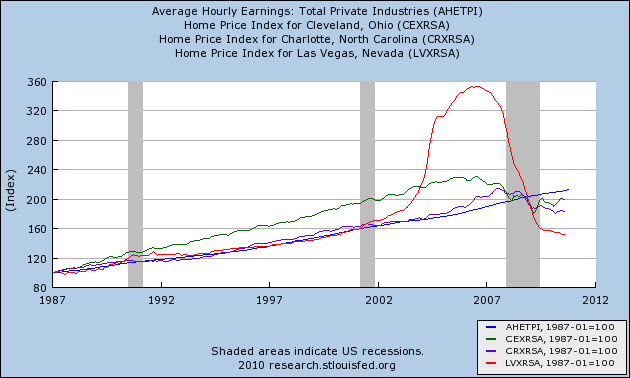
In all three of these cases, prices are actually lower now in real terms than they were 23 years ago or at any time since.
All of the above doesn't tell us that housing starts *will* increase this year, but it certainly suggests that if not this year, then either next year or the year after will see a significant increase. Further, the odds appear favorable that in at least some metropolitan areas, we will see an increase in building at some point this year.
Several commentators, notably Calculated Risk, believe that residential investment will probably increase - finally - late in 2011, thus going from a drag on the economy to a contributor to GDP growth. Since the housing bubble of the first part of last decade helped lead the economy into the "Great Recession", there has been consternation as to whether it could lead the economy out of the recession -- or at least finally contribute.
Several years ago, Prof. David Leamer helpfully noted that there was a housing bubble in the 1920s as well - that burst several years before the actual nonset of the Great Depression, and bottomed in 1933. Following up on that, I was able to find the data for "non farm housing starts" in the Statistical Abstract of the United States. I posted the results a year and a half ago in Housing during the Roaring Twenties and Great Depression. Included then was a chart that converted the equivalent housing starts to our time, by multiplying the data proportionate to the population for each year compared with our modern population of 300 million.
Adjusting for population makes a significant difference in how one looks at the data. Building 2 million new houses a year means something quite different in 2005 with a 300 million population, than in 1960 with a 160 million population. So adjusted, the 2000's housing bubble does not look so extreme:
Adjusting for population alone doesn't tell the whole story. There remain the issues of demographics and immigation -- in other words, one must consider the factors behind household formation. I discussed this more thoroughly here, but to summarize for this post, young people begin to move out of their parents' homes at about age 20. Those who marry very young form their own household, while young singles live with roommates. By age 25, new household formation rapidly accelerates, and continues through age 35, by which time close to the maximum percentage of people are living in their own or spouse's household.
Thus Boomer household formation coincided with the 1970's-1980's peaks, and the smaller cohort of Gen X coincides with 1990's lower numbers of housing starts. Gen Y, or the "Millenials" have already begun to form households, just as the housing bust hit.
With another year's passage of time and additional data, I am republishing the chart from my original post about housing during the Roaring Twenties and Great Depression, but I have expanded it. Not only does it adjust the 1920's figures to the current era by population, but also I am comparing the equivalent year from the Roaring Twenties and Great Depression with the last decade of housing starts, normed to the peak year, which are averaged on an annual basis to make an apples to apples comparison. All data is in 1000's:
| Year | 1920's-1930's Nonfarm housing starts (actual) | 1920's-1930's adjusted for population | 2000's housing starts adjusted for population |
|---|---|---|---|
| 1920/2000 | 247 | 699 | 1689 |
| 1921/2001 | 449 | 1236 | 1701 |
| 1922/2002 | 716 | 1953 | 1799 |
| 1923/2003 | 371 | 994 | 1932 |
| 1924/2004 | 893 | 2350 | 2014 |
| 1925/2005 | 937 | 2423 (high) | 2121 (high) |
| 1926/2006 | 849 | 2177 | 1837 |
| 1927/2007 | 810 | 2042 | 1347 |
| 1928/2008 | 753 | 1867 | 895 |
| 1929/2009 | 509 | 1252 | 546 |
| 1930/2010 | 330 | 805 | 592 |
| 1931 | 254 | 615 | --- |
| 1932 | 134 | 322 | --- |
| 1933 | 93 | 221 | --- |
| 1934 | 126 | 300 | --- |
| 1935 | 221 | 522 | --- |
| 1936 | 319 | 748 | --- |
| 1937 | 336 | 781 | --- |
| 1938 | 406 | 937 | --- |
| 1939 | 515 | 1179 | --- |
| 1940 | 602 | 1368 | --- |
In reviewing this chart, keep in mind that in 1930, 25% of the US population lived on farms, compared with only 2% today. Also be mindful that back then, the typical mortgage was a 5 year note that frequently included a balloon payment at the end.
The data shows that if anything, the 1920s boom was much more of a bubble than the recent one, and the ensuing eight year decline from 1925-1933 was more gradual but also sank to a lower level before bottoming.
At this point, according to recent Case-Shiller data, some housing markets are at near quarter century lows in prices. For example, here are Charlotte (green), Las Vegas (red), and Cleveland (purple) (CPI inflation in blue):
In all three of these cases, prices are actually lower now in real terms than they were 23 years ago or at any time since.
All of the above doesn't tell us that housing starts *will* increase this year, but it certainly suggests that if not this year, then either next year or the year after will see a significant increase. Further, the odds appear favorable that in at least some metropolitan areas, we will see an increase in building at some point this year.