Wednesday, April 7, 2010

They Really Like Us!!!!

From Briefing.com

The $21 bln reopened 10-yrs draw 3.9% with a record 3.72 cover and 43.1% indirect bidders. The market was rallying on the way into results with the market running to tag the 3.92% level. The yield was well under what was anticipated, meaning players were coming in more aggressively, willing to pay up whether they came in through the dealers or not, the direct bidders got a hefty 16.3%. The 10-yr has since swung to tip the 3.888% yield point.


There is understandably a great deal of fretting and nervousness regarding the US' overall debt situation. With a looming supply that is quite large there are a number of people who are arguing that interest rates are heading higher. In fact, it seems that the argument is not a matter of if but when.

However, notice that a4% yield is actually a pretty good yield in the current environment. The German 10 year is trading at 3.12%, the British 4 year is at 4.06, and the Australian 10-year is at 5.85%. So, 4% is actually a fairly attractive yield. In addition, the market took a major nosedive today, adding to the attractiveness of Treasuries.

Gold Breaks Out

Consumers Are Spending Again


From the NY Times:

After months of penny-pinching amid the recession, new figures — showing an improving job market, rising factory output and increased retail sales — suggest that consumers are no longer restricting their budgets to necessities like food and medicine. They are starting to buy clothes, jewelry and even cars again.

The mood has gone from panicked to cautious, and now, as Mark Zandi, chief economist for Moody’s Economy.com put it, some consumers are “almost a bit giddy.”

After the financial crisis hit in late 2008, consumers retrenched heavily. And in the months that followed, there were fears that newly frugal Americans would increase their savings so much there was no hope that consumer spending could be a factor in a recovery.

That was a troubling prospect because consumers have been the drivers of economic growth after past recessions. After all, their spending accounts for more than two-thirds of all economic activity in the United States.

But just a year later, consumers have eased off a bit on their savings, which frees up cash for them to spend. And in part because of the high rate of mortgage defaults, the overall consumer debt burden has been dropping. Those trends suggest to some economists that consumers may now be in a position to help drive the recovery.

The improved outlook has been showing up at store cash registers for several months, and the trend seems to be accelerating. Major retailing chains posted better-than-expected earnings in their most recent reporting periods and are likely to deliver more good news on Thursday, when they report their March sales results.

Let's look at the data.

Real (inflation-adjusted) PCEs have been increasing since the end of 1Q09.

The largest area of PCEs -- services (which account for over 60% of PCEs) never dropped. Instead, the spending on these goods leveled off.

Spending on non-duarbale goods has been increasing since about the middle of last year.


Durable goods are the main area where consumers have pulled back on their spending.


Yesterday's Market


a.) Resistance from Monday remained a factor for most of yesterday's action. Prices advanced several times beyond the line but could not maintain the momentum until after the release of the Fed's FOMC Minutes.

b.) Prices started out in a general uptrend, hit resistance from the previous day (a) and moved lower in a downward sloping channel (c).

d.) Prices started a sharp rally after the release of the Fed Minutes. Prices moved through resistance (e) and, after peaking, moved into a downward sloping channel (f) for the rest of trading.

Wednesday Commodities Round-Up


Since the beginning of 2009 copper has been in a rally (A).


A.) Copper starter a sharp rally at the beginning of February. Sharp rallies typically don't last because prices cannot maintain a an upward trajectory like this over time.

Along the way we've seen consolidation in two areas: B and C.

Prices have moved through (F) two important lines of resistance (D and E)

The main issue with this chart is the sharpness of the rally that started in February; rallies of that magnitude can't last.

Tuesday, April 6, 2010

Is Deflation Off the Table?

From Bloomberg:

Federal Reserve Chairman Ben S. Bernanke and European Central Bank President Jean-Claude Trichet can’t afford to let the economic recovery distract them from the danger of falling into a deflationary morass akin to Japan’s.

Core consumer prices, which strip out volatile food and energy costs, rose a record-low 1.5 percent in February from a year earlier in the 30 countries that form the Organization for Economic Cooperation and Development. Goldman Sachs Group Inc. economists see core inflation falling further later this year to about 0.3 percent in the U.S. and 0.2 percent in the euro area.

The disinflationary trend is driven by the slack built up during the global economic slump. The 1.9 percent growth in OECD economies that the Paris-based organization forecasts for 2010 still will leave their total output for the year 4.1 percent below potential. With that much excess capacity, companies will remain under pressure to cut prices to keep customers and reduce costs to bolster profit.

Policy makers have “gotten their eye off the immediate ball, which is deflation risk,” said Joseph Gagnon, a former Fed official who is now a senior fellow at the Peterson Institute for International Economics in Washington. “It’s misguided for anybody to be talking about exiting” from stimulus during the next year.

Investors can profit from slowing inflation by selling Treasury Inflation-Protected Securities, Michael Vaknin, global fixed-income strategist for Goldman Sachs in London, said in a March 29 note to clients. The gap between yields on Treasuries and so-called TIPS due in two years, a measure of the outlook for consumer prices, stood at 1.56 percent on April 5, down from 2.92 percent on June 16, 2008.

This is not an issue I'm worried about, but maybe the Fed should be?

Will Energy Prices Derail the Expansion?

From the Houston Chronicle:


More signs the economic recovery is taking hold sent oil prices to an 18-month high Monday but also stoked concerns that rising energy costs could put the brakes on the rebound just as it's getting started.

The jump in crude prices was attributed to encouraging reports on job growth Friday and on manufacturing and services activity Monday, when traders had a first chance to pounce on the news after markets were closed for the Good Friday holiday.

But some analysts warned that investors, in their haste to bet on the recovery, could push oil prices so high that consumers pull back on energy use and perhaps on other spending to compensate for energy's harder hit to their budgets.

“People really believe that when the U.S. recovers, U.S. oil demand is going to blow through the roof. And, quite frankly, at $85 a barrel, that's nonsense,” said Ken Medlock, an energy studies fellow at Rice University's Baker Institute.

Higher gasoline prices that come with rising crude costs could push Americans to drive less, and also to buy smaller cars, take fewer vacations and eat out less often, he said. “There's all sorts of ripple effects that high oil prices carry with them.”

On Monday, crude rose $1.75 to settle at $86.62 a barrel on the New York Mercantile Exchange, after making sizable gains last week as well. The price marked the highest close for crude since $88.95 a barrel on Oct. 8, 2008.

.....

U.S. gasoline demand dropped sharply following a spike in pump prices to $4.11 a gallon in July 2008 and remained sluggish in 2009 amid the recession. With the recovery still so fragile, the worry is that $3 gasoline right now could keep the economy in neutral.

First, note the economic numbers have bee getting better and better.

That means higher oil prices could be a problem once they get to a certain, undefined level. Last week I was filling up my tank and noticed that prices were $2.99/gallon. I was a bit surprised. But, given where oil's price currently is, it's to be expected.

If there is one thing that could really kill the expansion quickly, it's oil prices.


March Leading Economic Indicators

- by New Deal democrat

With one exception that should not materially change the result, the Leading Economic Indicators are now known for March. It looks like it will be another decent month. Here's the list:

The yield curve is still positive +0.38
Aggregate hours in manufacturing went back up sharply +0.30
Building permits turned positive again +0.12
ISM deliveries up +0.08
Durable goods' orders grew +.0.08
Jobless claims turned positive, +0.08
Stocks' 3 month performance is up smartly +0.06

Real M2 looks like it has gone negative again, -0.20
Consumer sentiment deteriorated again -0.02

Consumer nondurables ??????

Bottom line: it looks like March Leading Economic Indicators will net about +0.8, the eleventh positive reading in a row. This is a welcome increase after February's just-barely-positive number.

Remember the timing: positive LEI leads to positive GDP leads to job growth. Now that we have turned the corner on all three, the continuing positive LEI should mean continued positive GDP and jobs. Economic growth will almost certainly extend through the second quarter, but be more tepid than the 9 months from July 2009 through March 2010. Job growth should also continue, although a negative outlier (ex-census hiring) in this noisy series can't be ruled out.

On the other hand, the storm cloud I saw in the distant horizon for the second half of this year is getting closer and looking more ominous. More on that (hopefully) later this week.

Treasury Tuesdays


A.) Prices have finally broken through the neck line of the head and shoulders pattern.


A.) A little more than a week ago, prices gapped lower and printed a vbery strong downward moving bar.

B.) Prices consolidated right around the neckline.

C.) Prices gapped lower, again printing a strong bar.

D.) The EMA picture is turning bearish -- all the EMAs are moving lower, prices are below the EMAs and the shorter EMAs are below the longer EMAs.

Yesterday's Market


A.) Prices opened up And then moved higher on some very strong bars.

B.) Prices then spent most of the day in a very narrow range of approximately 20 cents

C.) Prices than moved higher on a volume surge (D).

Monday, April 5, 2010

ISM Services Up


From the ISM:

The report was issued today by Anthony Nieves, C.P.M., CFPM, chair of the Institute for Supply Management™ Non-Manufacturing Business Survey Committee; and senior vice president – supply management for Hilton Worldwide. "The NMI (Non-Manufacturing Index) registered 55.4 percent in March, 2.4 percentage points higher than the seasonally adjusted 53 percent registered in February, and indicating growth in the non-manufacturing sector. The Non-Manufacturing Business Activity Index increased 5.2 percentage points to 60 percent, reflecting growth for the fourth consecutive month. The New Orders Index increased 7.3 percentage points to 62.3 percent, and the Employment Index increased 1.2 percentage points to 49.8 percent. The Prices Index increased 2.5 percentage points to 62.9 percent in March, indicating an increase in prices paid from February. According to the NMI, 14 non-manufacturing industries reported growth in March. Respondents' comments are mostly positive about business conditions and the direction of the economy."


Let's take some of these in pieces:

In March, the NMI registered 55.4 percent, indicating growth in the non-manufacturing sector for the third consecutive month. A reading above 50 percent indicates the non-manufacturing sector economy is generally expanding; below 50 percent indicates the non-manufacturing sector is generally contracting.


Note -- this is the third consecutive month of growth.

ISM's Non-Manufacturing Business Activity Index in March registered 60 percent, an increase of 5.2 percentage points when compared to the seasonally adjusted 54.8 percent registered in February. Thirteen industries reported increased business activity, and three industries reported decreased activity for the month of March. Two industries reported no change from February. Comments from respondents include: "Seeing an increase in business. Our customers are feeling more optimistic"; and "New year budgets, as well as replacing inventories depleted during 2009."


Note the balance between increasing and decreasing industries -- 13 to 3 with an additional two showing no growth.

ISM's Non-Manufacturing New Orders Index grew in March for the seventh consecutive month. The index registered 62.3 percent, which is an increase of 7.3 percentage points from the seasonally adjusted 55 percent reported in February. Comments from respondents include: "Improving sales trend; capital money flowing with the start of a new year"; "More bids; work starting"; and "Prime selling month."


Note -- that is seven consecutive months of growth in new orders.

Employment activity in the non-manufacturing sector contracted in March for the 27th consecutive month. ISM's Non-Manufacturing Employment Index for March registered 49.8 percent. This reflects an increase of 1.2 percentage points when compared to the seasonally adjusted 48.6 percent registered in February. Six industries reported increased employment, eight industries reported decreased employment, and four industries reported unchanged employment compared to February. Comments from respondents include: "We are staffing to volume" and "Jobs are not being filled pending budget issues."


This is the one drawback to the report -- employment is still "contracting". From a numbers perspective, this is in line with the ADP employment report but not the BLS report.

Here are the anecdotal comments from the report:


  • "Business conditions have returned to normal (pre-recession). Our business is up significantly since 2009. We are very positive about the upcoming year." (Information)
  • "Demand for loans, credit cards, mortgages and equity lending is expected to continue to increase." (Finance & Insurance)
  • "Brisk business activity continues as more projects get 'green light.'" (Utilities)
  • "Observing some relaxation on several fronts regarding spending and hiring. Still very cautious, but making investments where they make sense." (Retail Trade)
  • "Limited funding available for development [and] expansions." (Accommodation & Food Services)
  • "The economy appears to be holding its own; however, state and local funding is projected to decrease next fiscal year." (Educational Services)

Finally, here is a chart of the index


This is a very good number aboud should provide some encouragement to the market.

A Complete Look At the Jobs Report

This article appeared on fivethirtyeight.com on Sunday.

On Friday, the BLS reported the latest job figures. As I will explain, this was a good report overall. Both the household and establishment survey printed some good, solid numbers. Put another way, it's pretty obvious the recession is over.

From the BLS:

Nonfarm payroll employment increased by 162,000 in March, and the unemployment rate held at 9.7 percent, the U.S. Bureau of Labor Statistics reported today. Temporary help services and health care continued to add jobs over the month.

Employment in federal government also rose, reflecting the hiring of temporary workers for Census 2010. Employment continued to decline in financial activities and in information.


Remember there are two surveys -- the household and the establishment. The household provides information for the unemployment rate. So, let's start there.


It appears the unemployment rate has topped out in the 9.5%-10% range. While we're not seeing any downward momentum, we aren't seeing anymore strong upside moves either.

Also note the unemployment rate continues to be high for those with low educational achievement and low for those with high educational achievement:

Unemployment rate for

Less than a high school diploma: 14.5%
High school with no college: 10.8%
Some college or associates degree: 8.2%
Bachelor's or higher: 4.9% (this is near full employment from an economic perspective).

The civilian labor force increased by 398,000. This led to an increase in the participation rate (the percentage of the population that is part of the labor force) of .1%, from 64.8 to 64.9. In addition, this number is the denominator in the unemployment calculation. Last month we also saw an increase of 134,000 in overall unemployment. That means the unemployment rate remained stable at 9.7%.

In addition, according to the household survey, the number of people employed increased by 264,000. This led to an increase in the employment to population ratio of .1%, from 58.5% to 58.6%.

Those "not in the labor force" decreased 238,000.

Unemployment numbers are presented in a time-based orientation. That means we look to see how long people have been unemployed. It begins with initial unemployment claims and then moves out to the number of weeks people are unemployed. With the exception of the 27 weeks and longer series, all these numbers are showing improvement.


The 4-week moving average of initial unemployment claims continues to move lower. This indicates that the number of people entering the ranks of the unemployed continues to drop.


The number of people unemployed for less than 5 weeks continues to drop. In addition, this number is approaching more "normal" levels.


The number of people unemployed for 5-14 weeks is also dropping. However this number is still very high and will require a fair amount of time to get back to a "normal" level.


The number of people unemployed for 15-26 weeks is also dropping. However this number is still very high and will require a fair amount of time to get back to a "normal" level.


The number of people unemployed for longer than 27 weeks is still increasing. The primary reason for this is a large percentage of job losses during the recession (over 70%) occurred in construction and manufacturing. Construction will never return to the levels seen in the last expansion and manufacturing is undergoing a productivity revolution where employees are being replaced by automation. As such, former construction and manufacturing employees will face an incredibly difficult job environment going forward.


Those working part time for economic reasons increased 263,000.

Let's move onto the establishment survey by beginning with this chart of job losses and gains:


First, note that from October of 2008 to March 2009 the economy lost over 600,000/month. That means that over a 5 month period the economy lost over 3 million jobs. In addition, remember that during the recession the economy lost all the jobs created in the last expansion:


I raise these two facts for the following reason. While there is understandable frustration with the current high rate of unemployment, it's important to remember the severity of the damage caused by the recession to the overall employment situation. To use a medical metaphor, a person who had quadrupole bypass on Monday will not be running a marathon on Friday. An economy that lost all of the jobs created in the previous expansion will not turn around and start adding 300,000 jobs/month anytime soon.

The establishment survey was solid. First, total private hiring was 123,000 -- meaning the "census workers tilted the numbers" argument is wrong. Secondly, goods producing jobs increased 41,000. This sector of the economy has been a drag on growth for the last few months. In addition, construction and manufacturing jobs account for the vast majority (over 70%) of all job losses during the recession. So an increase in this area of the jobs market is welcome.

In addition, both January and February job totals were revised higher:

The change in total nonfarm payroll employment for January was revised from -26,000 to +14,000, and the change for February was revised from -36,000 to-14,000.


In addition, service jobs saw an increase of 82,000, with only two service sector areas (financial services and information technology) showing decreases.

While average hourly earnings decreased (largely because of labor market slack) weekly hours increased by .1 because the index of aggregate weekly hours increased from 91 to 91.4. This means weekly earnings increased from $762.41 to $763.98.

Overall, this is a solid report.


New Deal Democrat 1, Econoblogosphere 0 (Mish -1)

- by New Deal democrat

Back in September, I wrote a little rant about initial jobless claims and their relationship to job growth:
Some time ago, Prof. Brad DeLong of Berkeley, thinking aloud with graph, drew a line across the 1991 and 2001 recessions and recoveries, making a "note to self" that it appeared that Initial Jobless Claims post those recessions had to decline to 400,000 or less before payroll jobs were added. Thus, mused Prof. DeLong, it must be so as well, post this "Great Recession." This "note to self" was subsequently repeated by Bill McBride at Calculated Risk, from which it has now been picked up and repeated at Prof. James Hamilton's site, Econbrowser. It is well on its way to becoming Holy Writ.

Let me say first of all that I have the highest respect for all 3 of the above gentlemen. Nevertheless...

IT IS WRONG.

The 1991 and 2001 recessions were very mild. Peak initial jobless claims in those recessions were 501,250 and 489,250, respectively. It would be nuts to think that jobs would be added to the economy anywhere near the 500,000 high water mark in jobless claims from those recessions.

The 1973-4 and 1981-2 recessions are much better comparisons.... In the case of the recoveries from both of those recessions, payrolls started to grow as the ievel of initial jobless claims crossed 500,000, not 400,000.
Indeed, the Holy Writ was subsequently repeated by such luminaries as Prof. Mark Thoma of Economist's View, Nobel prizewinner Prof. Paul Krugman, and by Mike Shedlock a/k/a Mish, who went even further, saying:
Weekly claims have to drop to about 400,000 to be at a point that is normally consistent with the economy adding jobs. I question whether normally applies.
I should point out that Prof. Delong was a good sport, going so far as to repost my rant at his blog, and to drop by here and comment that he hoped I was right.

With 3 of the last 5 months showing job growth, and jobs having bottomed in December and retested that low in February, here is how it actually panned out:

November +64k jobs, 492k average initial claims
December -109k jobs, 474k average initial claims
January +14k jobs, 478k average initial claims
February -14k jobs, 467k average initial claims
March +114 jobs*, 447k average initial claims
(*non-census)

Initial claims dropped below 500k during the week of November 21. The average for the period November through February, at the bottom of employment, was 478k initial claims. Even including March in the average only drops the average to 472k initial claims. In short, the jobs numbers bottomed when initial claims dropped below 500,000 to about 475,000, not to 400,000 - not exactly as I had predicted, but a lot closer than the rest of the econoblogosphere.

You may file this under 'even a blind squirrel finds a nut from time to time' but hey, a little credit here! You're reading the right blog.


Market Mondays


Let's start with a view I don't often use -- a simple line chart. Notice that prices have broken through resistance at B but have also broken upward sloping trend line A. Prices are currently in an upward sloping pennant pattern.


A.) Notice that last week all the bars were weak -- all the bodies were small with fairly long wicks. In addition volume was weak (B).


Notice that prices could not keep their upward momentum on any day last week. That tells us traders were extremely concerned about something.


A.) The EMA picture is still great -- the shorter EMAs are above the longer EMAs, all the EMAs are moving higher and prices are above all the EMAs. But

B.) The MACD has given a sell-signal and

C.) We're seeing the A/D line stagnate.

Friday, April 2, 2010

Weekend Weimar and Beagle

Mrs. Bonddad and I have a very important announcement -- we have a new fur kid! Her name is Kassie, and she is a 13 inch Beagle. She is the top picture. Everyone is getting along very well. Our next project is to get another medium size girl for Sarge -- thereby giving him a harem....


The Weekly Indicators Kick A** Edition

- by New Deal democrat

With the exception of personal income (stagnant) and construction spending (still tanking), all of the monthly data this week was neutral to excellent.

The economy added 162,000 jobs in March, only 48,000 of which were census jobs, a kick-a** good number. Hours worked were up, the employment participation rate was up, and January and February were revised up.

Unemployment stayed the same at 9.7%, which is unacceptably high, of course, but nevertheless a decent result with the workforce adding 298,000 new persons.

March Auto sales were less than 12 million annualized, but still the highest in 7 months.

Chicago PMI was good, and the ISM manufacturing report was kick-a** stellar, showing increasingly strong positive activity in almost all sub-indices.

Turning to the high frequency weekly numbers ...

The ICSC reported that seasonally adjusted weekly same store sales we up 3.2% YoY (an easy comparison) and up 0.6% from the previous week. ShopperTrak reported that "year-over-year GAFO retail sales increased a 2.7 percent for the week ending March 27 while sales slipped 1.0 percent versus the previous week ending March 20." Retailers are apparently telling analysts that their March sales are kicking a**.

The E.I.A. reported that gasoline cost $2.80 a gallon. Oil was near $85/barrel late in the week. This is going to be a major concern later in this year. Usage was lower YoY as reported in the chart, but higher in the graph immediately below at their site. I have no idea why.

The BLS reported that new jobless claims were only $439,000, the lowest in about 18 months. The 4 week graph shows that the downward trend is established again.

Railfax again showed another strong week. All 4 components of transportation were up strongly, and 3 were also up strongly vs. last year. Rather than me try to describe, click on over and look at the graphs yourself. Rail traffic is also kicking a** YoY.

Daily Treasury Statement shows that March withholding taxes totaled $164.9B. That isn't just about $9B above March 2009 (about 5%), it is also several $billion higher than March 2008! Angry Bear has updated their graph of daily withholding taxes measured YoY, and here it is:


Another kick-a** report.

Everybody have a great weekend, hopefully the weather will be beautiful where you are. Maybe we can even get Bonddad to post some doggies....

NFP +162,000


From the BLS:

Nonfarm payroll employment increased by 162,000 in March, and the unemployment rate held at 9.7 percent, the U.S. Bureau of Labor Statistics reported today. Temporary help services and health care continued to add jobs over the month.
Employment in federal government also rose, reflecting the hiring of temporary
workers for Census 2010. Employment continued to decline in financial activi-
ties and in information.


First, let's remember there are two surveys -- the household and the establishment. The household provides information for the unemployment rate. So, let's start there.


It appears the unemployment rate has topped out in the 9.5%-10% range. While we're not seeing any downward momentum, we aren't seeing anymore strong upside moves either.

Also note the unemployment rate continues to be high for those with low educational achievement and low for those with high educational achievement:

Unemployment rate for

Less than a high school diploma: 14.5%
High school with no college: 10.8%
Some college or associates degree: 8.2%
Bachelor's or higher: 4.9% (this is near full employment from an economic perspective).

The civilian labor force increased by 398,000. This is a very important number because it is the denominator in the unemployment calculation. Last month we also saw an increase of 134,000 in overall unemployment. That means the unemployment rate remained stable at 9.7%.

The participation rate increased .1%, indicating more people are moving back into the civilian labor force.

Those "not in the labor force" decreased 238,000.

Those who were unemployed between 0 and 26 weeks decreased as well. The only time category that increased was the 27+ weeks unemployed.

Those working part time for economic reasons increased 263,000.

The establishment survey was solid. First, total private hiring was 123,000 -- meaning the "census workers tilted the numbers" argument is wrong. Secondly, goods producing jobs increased 41,000. This sector of the economy has been a drag on growth for the last few months. In addition, construction and manufacturing jobs account for the vast majority (over 70%) of all job losses during the recession. So an increase is welcome.

In addition, service jobs also saw an increase 82,000, with only two service sector areas (financial services and information technology) showing decreases.

While average hourly earnings decreased (largely because of labor market slack) weekly hours increased by .1 meaning weekly earnings increased from $762.41 to $763.98. The index of aggregate weekly hours increased from 91 to 91.4

Overall, this is a solid report.

Let me add this caveat. On August 22, 2009, I wrote the following:

Now -- that leads to the final question: when will the jobs come back? In order for that to happen we need to see at least one quarter of a positive GDP and probably two. That means the soonest we can expect a drop in the unemployment rate would be the a few months from now and that is only under the rosiest of scenarios. The most likely possibility is it won't be until the end of the first quarter of next year before we start to see a ticking down (and that assumes a stronger rate of growth than I think is going to happen).

Forex Fridays

Starting with the big picture, prices are in a clear uptrend, although they are approaching important technical support. The EMAs are in a bullish configuration, but the 10 and 20 day EMAs have recently turned lower. Prices are also below the 10 and 20 day EMA, which will pull prices lower going forward. The MACD is about to give a sell-signal. Also note the degree to which money has flowed out of the security (the A/D line at the bottom).


In the last few weeks we've had several large gaps higher (very bullish) and several gaps lower (bearish). The real question to ask about this chart is this: is the last gap higher an exhaustion gap -- the last hurrah of the bulls?


Last Wednesday we had a big gap higher (A) followed by an island reversal (B). Prices gapped lower for two days (C) and then gapped lower again (D). Note that prices are generally in a lower trending orientation right now.

Yesterday's Market


Consider the price action for the entire week.

A.) On Monday, prices gap higher, attempt a rally in the AM that fails and then spend the rest of the day trading sideways. Prices do move higher at the end, but can't get above highs set in the AM.

B.) On Tuesday, prices gap higher at the opening, attempt a rally but the rally quickly stalls. Prices close near the open.

C.) On Wednesday, prices gap lower in the AM, rally to around the opening price and stay there for most of the day until a late day sell-off puts prices back about where they started.

D.) Yesterday, prices gap higher at the open but can't hold the momentum. The fall until a late day day places prices near the open.

As a result of this action, you get the following daily chart:


Note the incredibly weak bars over the last few days.

In short, all week long we've seen an extraordinary lack of momentum in the market.

NFP +162,000


From the BLS:

Nonfarm payroll employment increased by 162,000 in March, and the unemployment rate held at 9.7 percent, the U.S. Bureau of Labor Statistics reported today. Temporary help services and health care continued to add jobs over the month.
Employment in federal government also rose, reflecting the hiring of temporary
workers for Census 2010. Employment continued to decline in financial activi-
ties and in information.


First, let's remember there are two surveys -- the household and the establishment. The household provides information for the unemployment rate. So, let's start there.


It appears the unemployment rate has topped out in the 9.5%-10% range. While we're not seeing any downward momentum, we aren't seeing anymore strong upside moves either.

Also note the unemployment rate continues to be high for those with low educational achievement and low for those with high educational achievement:

Unemployment rate for

Less than a high school diploma: 14.5%
High school with no college: 10.8%
Some college or associates degree: 8.2%
Bachelor's or higher: 4.9% (this is near full employment from an economic perspective).

The civilian labor force increased by 398,000. This is a very important number because it is the denominator in the unemployment calculation. Last month we also saw an increase of 134,000 in overall unemployment. That means the unemployment rate remained stable at 9.7%.

The participation rate increased .1%, indicating more people are moving back into the civilian labor force.

Those "not in the labor force" decreased 238,000.

Those who were unemployed between 0 and 26 weeks decreased as well. The only time category that increased was the 27+ weeks unemployed.

Those working part time for economic reasons increased 263,000.

The establishment survey was solid. First, total private hiring was 123,000 -- meaning the "census workers tilted the numbers" argument is wrong. Secondly, goods producing jobs increased 41,000. This sector of the economy has been a drag on growth for the last few months. In addition, construction and manufacturing jobs account for the vast majority (over 70%) of all job losses during the recession. So an increase is welcome.

In addition, service jobs also saw an increase 82,000, with only two service sector areas (financial services and information technology) showing decreases.

While average hourly earnings decreased (largely because of labor market slack) weekly hours increased by .1 meaning weekly earnings increased from $762.41 to $763.98. The index of aggregate weekly hours increased from 91 to 91.4

Overall, this is a solid report.

Thursday, April 1, 2010

Initial Unemployment Claims Drop

From Bloomberg:

Fewer Americans filed claims for jobless benefits last week, bringing the average over the past month to the lowest level since 2008, as the economic recovery prompted companies to retain staff.

Initial jobless applications declined by 6,000 to 439,000 in the week ended March 27, in line with the median forecast of economists surveyed by Bloomberg News, Labor Department figures showed today in Washington. The number of people receiving unemployment insurance was little changed, while those getting extended benefits rose.

Employers are slowing job cuts, a sign of confidence, as the U.S. emerges from the worst recession since the 1930s. Sustained employment gains are needed to boost consumer spending, which accounts for about 70 percent of the economy.

“We are turning a corner in the labor market,” said Julia Coronado, a senior U.S. economist at BNP Paribas in New York, who had forecast a decline in the weekly jobless claims. “Businesses are gradually starting to have more confidence in the recovery.”

.....

Employers announced fewer job cuts in March than a year earlier, another report showed today. Planned firings fell 55 percent last month to 67,611 from 150,411 a year earlier, according to data collected by the job placement firm Challenger, Gray & Christmas Inc. Announcements increased from February’s three-year low of 42,090.

Let's go to the data:


A few weeks ago, I expressed concern about the initial claims numbers, largely because they seemed to be unable to continue to move lower. Over the last several weeks we've seen those numbers drop a bit which eases my mind. However, a continued move lower to the 400,000 range is really needed right now.


The job cut number has been pretty low for awhile now and points to continued improvement in the jobs market.

State Tax Revenues & Withholding Taxes Increase

- by New Deal democrat

Most of my analysis proceeds from the view that leading indicators still lead, and lagging indicators still lag. While no approach is perfect, you will be right a lot more than most armchair (and highly-paid) pundits if you simply proceed from the premise that It Isn't Different This Time, and that while each recession, recovery, and expansion will have areas of variance from the norm (as in housing bubble and bust that still persists), in the main they will abide by past patterns. I parted from the vast majority of the doomish econoblogosphere almost a year ago when I noticed that consumers were refusing to play dead but, zombie-like, were rising from the grave to spend again, at least making a bottom in those figures. Shortly thereafter, the Leading Indicators almost all began to stabilize or even turn positive, in the face of the most severe economic downturn in decades.

As time has gone on, more and more of the bearish argument has focused on lagging indicators, and as an exercize to show that they do indeed lag and would turn positive in time, just as in prior recoveries, I have been tracking them here.

Most pointedly, back in November, Lee Adler of the Wall Street Examiner wrote a piece called Retail Sales Data, Tell me another Joke in which he said:

The reported rise in retail sales this morning had the media had in a full throated bull chorale...But as usual it’s all hype, little substance. A dead cat bounce is not a recovery. The “recovery” the pundits are talking about is little more than a semantic game. Bernanke sounds more like Chauncey Gardener every day. If this is recovery it must be just like the “recovery” that took place in the 4th quarter of 1929 and first quarter of 1930.
Adler's piece was quickly picked up by the usual suspects, as proof that the Recovery was illusory. Now, I respect Lee Adler a lot, and in particular he was one of few non-permabears who called the September-October 2008 crash ahead of time. But the fact is that state and withholding tax collections lag. You have to have the recovery and the hiring first, before people pay taxes on their new jobs and revenues!

This was an argument I had already had last July at the place where I used to blog, when they claimed that the worst state tax revenue declines in 46 years meant Doom was upon us. I pointed out in a comment that the bottom in revenues would come one or two quarters after the bottom in the economy, to no avail, because in January of this year, they did it again, claiming If this is a Recovery, shouldn't tax revenue be increasing?

Now we know that even before they were writing this, in the last quarter of 2009, according to an article in Business Week, state tax revenues were indeed beginning to increase, one to two quarters after the bottom in the economy, just like I said they would:

The two-year slide in tax collections that opened a $196 billion gap in U.S. state budgets has stopped, easing pressure on credit ratings and giving leeway to lawmakers as they craft spending plans for next year.

The 15 largest states by population forecast a 3.9 percent gain in tax revenue in fiscal 2011, budget documents show. The 50 states on average may increase collections by about 3.5 percent, the first time in two years the figure is expected to grow, said Mark Zandi, chief economist at Moody’s Economy.com,
....

Combined state and local tax collections climbed to $360.1 billion during the final three months of 2009 , the first year- over-year gain in five quarters and an almost 1 percent boost from the same period in 2008, according to the agency.
....

“We’ve seen the worst,” said Philip Condon, who oversees about $9.4 billion in municipal bonds for DWS Investments in Boston. “While it may not be great, it’s getting better.”
Although getting recent, accurate state tax receipt data on the internet is fiendishly difficult, it nevertheless appears that once again, Mish unintentionally bottom-ticked an economic indicator a month ago when he highlighted the shortfall in November 2009 state revenues.

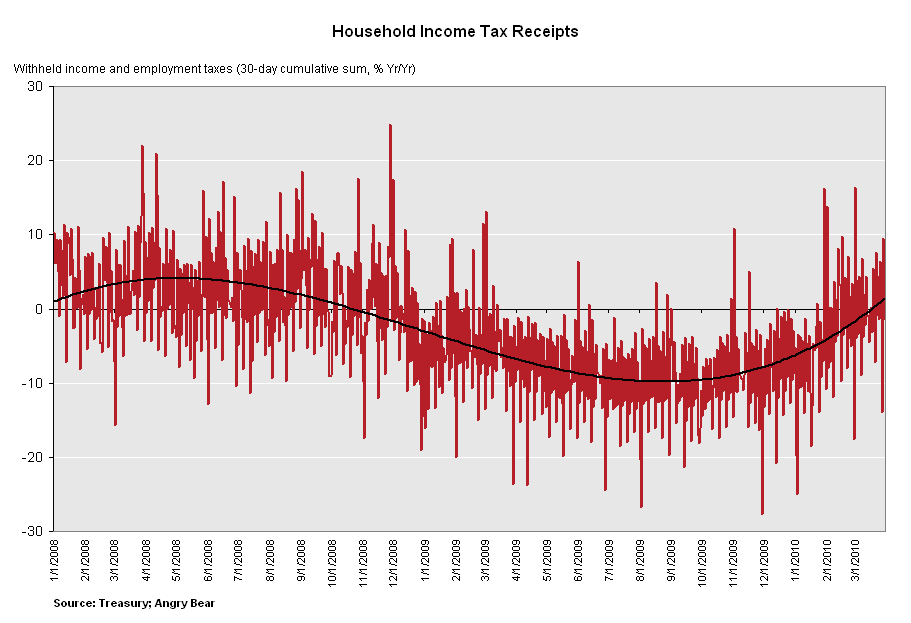
Adler's piece noted that the reporting of state tax revenue (by the Rockefeller Institute) lagged badly, usually 4 months behind the collections. So he made use of the Daily Tax Receipts (h/t Matt Trovisonno) for more recent information, claiming that they too showed a non-Recovery. The TrimTabs mantra of poor withholding receipts comparisons had also been picked up by others of the Doomish persuasion. But of course those taxes too are lagging indicators, and as I've been noting weekly for the last few months, the YoY comparisons kept getting better and better until this month, they finally surpassed the taxes withheld in March 2009. As I write this, with one day left of reporting, March 2010 taxes withheld are already ahead of last year, $159.2B to $156.0B (and nearly equal to the March 2008 figure of $162.6B).

Well, TrimTabs will no longer give them comfort either, because as of yesterday they claim that the economy added between 80,000 and 130,000 non-Census jobs in March. [Note: I am not endorsing their analysis, which has been suspect in the past. The point is that in the parlance of sandlot baseball, "your own man says so."]

Leading indicators still lead, and lagging indicators still lag. It wasn't different this time. With their withholding, sales, and state revenue arguments gone or rapidly dissipating, there really is very little (bank loans, but historically those lag too) in the statistical data left for Doomsters to hold onto.

ISM Manufacturing Index Shows Further Strong Expansion

- by New Deal democrat

The ISM Manufacturing Report for March 2010 showed almost across the board increases. Only employment (at 55.1) and the backlog of orders (at 58.0) decreased slightly, meaning both increased, but at a slightly slower rate. Exports also increased at a faster rate, as did every other component of the index.

The overall index increased to 59.6, the highest since July 2004. Indeed, this is the strongest ISM number since the 1982 recession, with the exception of 9 months in 1984, 2 in 1987, and 8 in 2004. There is simply no doubt now that manufacturing is having a V-shaped recovery and is leading the way in the economy.

Here are the sample quotes provided by the ISM:
• "Certain markets served have increased by 50 percent in new customer orders, while other markets are not as strong." (Miscellaneous Manufacturing)
• "Business levels continue to be strong coming out of the Chinese New Year. First quarter will be our best since 2000." (Machinery)
• "Business is steady and prospects are good for Q2." (Food, Beverage & Tobacco Products)
• "After-market sales are improving as more vehicles require maintenance." (Transportation Equipment)
• "There is a serious shortage of basic electronic components, and lead times are becoming a problem. We are also seeing dramatic price increases." (Computer & Electronic Products)
As to employment, the ISM said:
This is the fourth consecutive month of growth in manufacturing employment. An Employment Index above 49.8 percent, over time, is generally consistent with an increase in the Bureau of Labor Statistics (BLS) data on manufacturing employment.
Although it would have been nicer had the employment index increased, showing faster growth, this is an almost perfect report, and its leading component adds to the likelihood that March's Index of Leading Indicators number will be quite good, meaning continued growth in the next 3-6 months.

From Bonddad

Here is a chart of the overall ISM reading:


This is not simply a one and done situation -- that is, we aren't just seeing one good number out of a series of bad numbers. This number has continued to rebound from low levels for some time -- as in over one year. The shows the underlying economy is strengthening and has been for some time.

In addition, consider this chart of the industrial sector:


Prices are in a strong uptrend (A) and the EMA picture is strong -- shorter EMAs are above longer, all EMAs are rising and prices are above all the EMAs. The two problems with this chart are the same problems that exist with the larger averages -- momentum is decreasing (C) and the money flowing into the security is slowing (D). The last two indicate we may be setting up for a correction in the near term.

Yesterday's Market

All of the charts below tell the same story: prices have broken important uptrends and the MACD is giving a sell-signal. This is the case with the big caps (SPYs), mid-caps (IWRs), small caps (IWMs), microcaps (IWC), and transports (IYT). In addition, over the last few weeks we've seen the leaders -- indexes that increased -- move from the smaller indexes (IWCS and IWMs) to the larger stocks. This indicates a move to more conservative investments.


Thursday Oil Market Round-Up


The oil market chart has been very perplexing for some time. Consider this yearly chart with simple price bars and nothing else:


There is just not a lot to sink you teeth into on that chart. In general, prices have moved between a few prices, but that's about all you can say. Ideally, we want to see prices move firmly in any direction. Instead, there has been a lot of zig-zagging between points.

That being said, let's look a little closer at the chart:


A.) For the last few weeks, prices have moved between two different price levels: 40.40 and 38.30.

B.) The EMA picture is turning bullish: the shorter EWAs are moving higher and the shorter EMAs are above the longer EMAs. But we've seen the EMAs bounce around the 200 day EMA for the last few months, advancing and then declining, only to advance again.

C.) Momentum is about to give a buy signal and

D.) Money is flowing into the stock.

Ideally the last two indicators tell us we're going to see a move higher, through some of the upside resistance areas. This would coincide with the "summer driving season."