Let's start with a look at the SPYs EMAs. First, the 10 and the 20 are rising, indicating the short-term trend is positive. The 50 (along with the 10 and 20) is just below the 200. Most importantly, notice the EMAs are moving into a bunched pattern -- a place where they are in an extremely tight range. This indicates lack of decision on the part of traders.

Notice the QQQQs are in a similar position. However, they are above the 200 day EMA (a) but on a very weak volume reading (b).

On the IWMs, notice the A/D line is declining, indicating people are leaving the market. However,

We have only recently seen a similar dip in the IWCs -- the micro-caps.
Overall what I find interesting about the A/D readings is they don't indicate a mass exodus from the market. Instead, there is a slight decrease in participation.


Both the IEFs and TLTs are approaching important technical points. Considering how important the flight to safety trade has been over the last few months, these are very important charts.


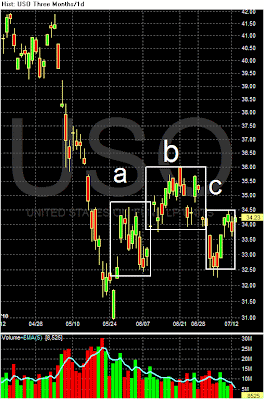
The primary story with the oil market is there is no clear trend, either on the 5-minute or daily chart. Prices are jumping around, gapping up and down, but here is no clear trend up or down. Instead, prices are simply meandering. Over the last 10 days we have three (a, b and c) trading areas; we have the same situation with the daily chart.