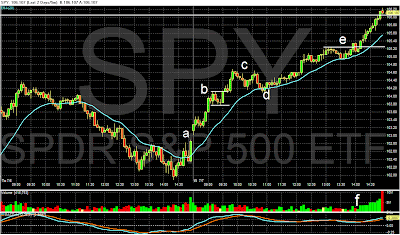
Let's start with the big news from yesterday -- the big rally in the equity markets.

At the close, prices just got above key resistance.

Taking a closer look at the price action, prices gapped higher at the open, rose and then consolidated in a bull market pennant pattern (b). Next prices formed a double top (c), but found support at the 20 minute EMA (d) instead of moving lower. Prices continued to move higher, and eventually moved through key resistance before the close (e). Also note the increasing volume as the day wore on (f).

On the daily chart, prices rose above the 10 day EMA.

Agricultural prices have caught a bid -- note the strong move yesterday (a) and the increased trading volume over the last few days (c). Also note the 10 and 20 day EMAs are about to cross the 50 day EMA -- a bullish crossover.
The fundamental reason for this move is a drop in estimated crop yields coming out of Russia.

The dollar continues to move lower, as prices have now moved though the 10, 20 and 50 day EMA (a). Also note the 10 day EMA has crossed below the 50 day EMA and the 20 day EMA is about to do so as well.

The daily chart shows some pretty big price moves. Last Thursday prices gapped lower in a big way (a) crossing below important support (b). Prices have clearly been trending down since (c).