No, not in prices, that is probably still several years and more than 10% away. But have new home sales and starts bottomed? It looks like we are groping for a bottom now, and it is at least possible that it may have already occurred several weeks ago.
The cliff-diving in new home purchases and mortgage applications is a critical reason for the sudden slowdown in the economic numbers since late April. The Euro crisis, the Gulf catastrophe, the price of Oil and real income stagnation also have played important roles. As Bonddad pointed out yesterday, it appears that the Euro crisis has eased, taking that off the table for now. The Oil well at the bottom of the Gulf of Mexico has been capped, and we can cross our fingers that that crisis has reached its maximum. Oil prices have eased somewhat as well, and with the decline in inflation, there may be a little breathing room on the income front for now.
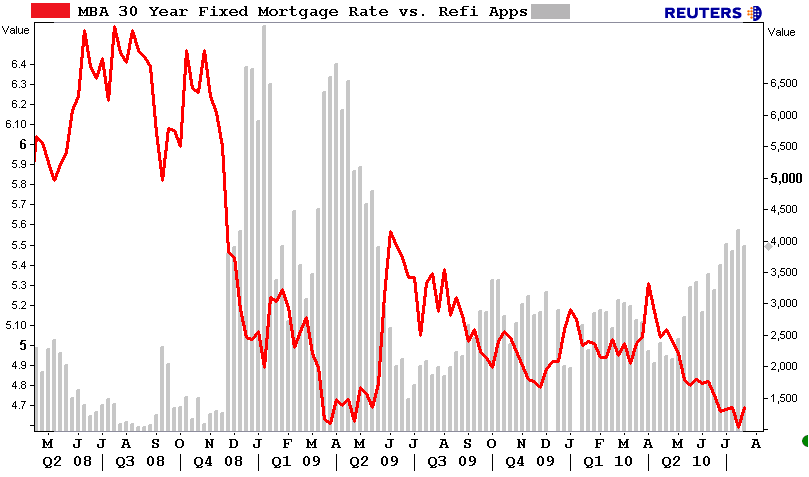
Readers know that I have been tracking purchase mortgage applications weekly, looking for signs of a bottom. This week, for the first time since April 30, applications for purchase mortgages rose for the second week in a row (all graphs from Mortgage News Daily):

Saying that Purchase Apps Search for Bottom, they quote the Mortgage Bankers Association release, noting
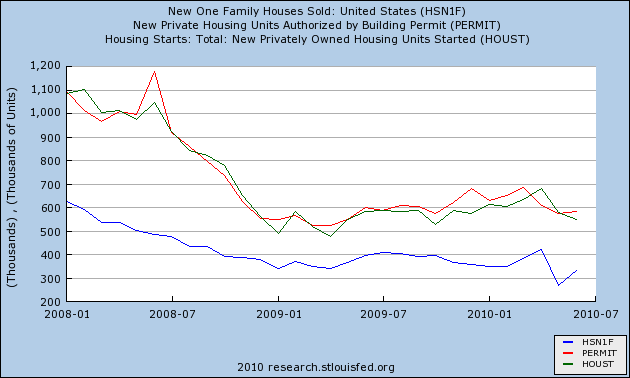
The seasonally adjusted Purchase Index increased 2.0 percent from one week earlier and is the highest Purchase Index observed in the survey since the end of June. The unadjusted Purchase Index increased 2.4 percent compared with the previous week and was 34.3 percent lower than the same week one year ago. The four week moving average is flat for the seasonally adjusted Purchase Index.It isn't just purchase mortgage applications. The Census Bureau reported on Monday that sales of single family homes rebounded strongly in June from an abysmal May (blue), and Permits also rose slightly from their May reading as well (red). Only starts, which frequently lag behind permits by one month, continued to decline in June (green):

Refinancing mortgage applications also continue at an elevated rate, aided by low interest rates:

From early 2006 through the end of 2008, housing sales, permits, and starts plummeted by some 75%. By early 2009 I was writing that they probably would bottom at some point last year, because at that rate of decline, they would be a zero this spring!
A look at trends in asking prices and inventory in 50 metro areas from Housing Tracker gives us a closer look at what has happened. In many areas that were the epicenter of the bubble last decade, prices have fallen substantially since the expiration of the housing credit. For example, in Phoenix, AZ, the median asking price has declined from $169,700 in April to $152,800 in mid-July (that's over 10% in 3 months!). Here is what happened to the number of houses on the market:

An entirely different dynamic is playing out in a few other places, most notably California, where the increase in sales due to the housing credit apparently convinced people that housing prices had firmed again. Compare Phoenix, above, with San Diego, California, where asking prices from April to mid-July actually increased from $387,000 to $399,000!

It is obvious that the $8000 tax credit pulled sales forward, preventing a full bottom from taking place in 2009. In order to make up for that difference, prices need to fall $8000. Sales in those places where they have are not badly impacted. Those places where they haven't, like California, have seen another dramatic slowdown. Once those prices decline again, demand for existing housing will slowly rise, and the backlog of houses on the market will slowly be worked off (it will take several years). In any event, the post-credit-withdrawal new housing sales market appears to be in the process of bottoming.
That doesn't mean we can have a happy dance. But if this is the bottom, any double-dip in the economy caused by housing (remember: housing always leads) will be shallow. If there is an actual rebound in the next few months, there won't be a double-dip at all, just a slowdown.
And I have to note one final piece of evidence: on July 14, possibly at the very nadir of the purchase mortgage index, that perennial accidental contrarian indicator, Mish, said to Expect Second Half Housing and Durable Goods Crash, highlighting that week's report that "[t]his was the lowest Purchase Index observed in the survey since December 1996."
Perfect.
Perfect.