Last week I wrote that "If we are going to have a double-dip, I would expect permits to follow the MBA index to new lows. On the other hand, if the consensus estimate of 655k permits issued in May turns out to be correct, and there is a rebound in housing permits this month, then the odds of a double-dip become very low."
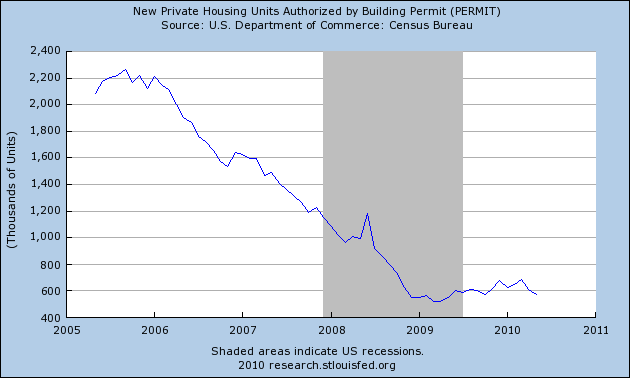
Like retail sales last week, yesterday's news on housing starts was decidedly not good. Housing Permits continued to decline sharply from their March high of 685,000, to 574,000 in May on an annualized basis (The all time low was 522k in March 2009).
The silver lining is that, after declining 6.7% last week, the MBA purchase index increased 7.2% this week. I don't have an updated graph of the MBA purchase index, this one is from two weeks ago:
With yesterday's data, the MBA purchase index is slightly above the last point on this graph.
As Bonddad has pointed out, the Industrial Production and Capacity Utilization numbers yesterday were excellent -- manufacturing's V-shaped recovery continues. But they are coincident, not leading, indicators.
The good news is, I strongly suspect the post-$8000 collapse in housing permits is near or at bottom. This is supported by the rebound in the MBA index, even if it is only one week's data. The more important question is whether there is a quick, significant rebound up above 600,000 building permits, or whether we languish in the 500,000s for a number of months. I am inclined to believe there will be a rebound, and although Calculated Risk has cautioned me that permits and the MBA purchase index only have a loose relationship, continuing to track that index is going to be our most timely indicator.
Bottom line: yesterday's housing permits number increases substantially the likelihood of a complete stall, if not a double-dip, in the economy in the third quarter.