With this morning's release of the ISM Non manufacturing index, I wanted to update post I wrote a couple of months ago looking at the correlation between both the ISM Manufacturing and Non manufacturing indexes and nonfarm payrolls.
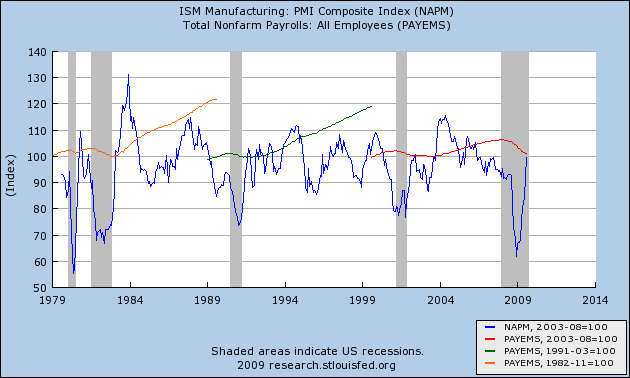
Last September when I was putting together a "Leading Index" exclusively for employment, I included the ISM Manufacturing index, which had always signaled growth in jobs whenever it crossed 53 (the iindex is a diffusion index, subtracting negative from positive responses, with neutral being at 50. Above 50 is expansion, below is contraction). Here is the graph I created at that time, with the trough in employment for each recession normed at 100, and the ISM Manufacturing index normed to cross that 100 jobs reading at 53:

The ISM's Non manfuacturing index, however, proved to be important in calculating when the jobs number actually turned from negative to positive in this Recovery, even though it is only 13 years old. So in March I refined the jobs leading indicator to include the following:
(1) the ISM manufacturing index be above 50 and ISM non manufacturing business activity above 48 as an initial signal; and
(2) both indexes be above 52 and average 53 or higher as a final signal, which gives one or two months' lead time to job growth. That signal was triggered for one month in October (accurately) and again for February.
With the ISM manufacturing index in April reading 60.4, and this morning's ISM non manufacturing index reading 55.4, the average at 57.9 is well into the job growth range.
[As an aside, the Non manufacturing index itself generally went sideways in April, signalling continued growth, but growth neither accelerating nor decelerating. Notably, new orders grew at a slower rate (a negative), but supplier deliveries slowed down further (a positive). The employment index declined very slightly from 49.8 tp 49.5, essentially a neutral reading.]
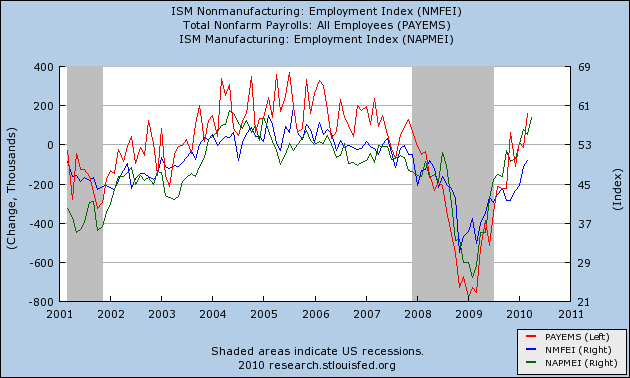
Although the employment subindexes are not leading but concurrent, they can serve as an important confirmation of growth or contraction in jobs. In the below graph, the ISM Manufacturing employment index is in green, Non manufacturing in blue, and Nonfarm payrolls monthly gain or loss, in thousands, in red (not including this morning's data):

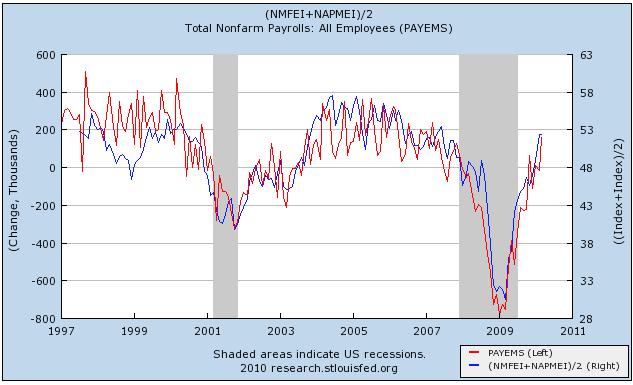
It's pretty easy to see that the ISM employment subindexes indicate job growth at least as strong as the average growth in employment during the last economic expansion. That becomes even more apparent when we edit the above graph to average the ISM Manfucturing and Non manufacturing employment indexes into one line (blue below - does not include this month):

Here's a chart of the improvement in both employment indexes for the last six months, Manufacturing on the left, Non manufacturing in the middle, the combined average on the right:
Month Mfg Nonmfg avg
2009-11-01 49.6 41.7 45.6
2009-12-01 50.2 43.6 46.9
2010-01-01 53.3 44.6 49.0
2010-02-01 56.1 48.6 52.3
2010-03-01 55.1 49.8 52.4
2010-04-01 58.5 49.5 54.0
Because nonfarm payroll data is "noisy," this doesn't translate into a specific number for Friday, but it certainly adds to the evidence that job growth will average a somewhat stronger number than most are anticipating.


3 comments:
I guess this correlation presupposes that this recession and the recovery from it is like any other recession and recovery.
The ISM Non-Manufacturing Report Employment Index this month decreased 0.3 to 49.5. This was the 28th consecutive month of contraction in employment in this arena. This non-manufacturing segment is some 80 percent of the non-farm, non-government part of the jobs market.
One thing that is for sure, Congress at the moment seems to have drawn a line in the sand at 99 weeks of unemployment benefits. So in the very near we are going to find out whether or not there really is a recovery going on and whether or not there are jobs to be had.
We have quite a number of temporary jobs out there - especially with the Census. And the jobs that are being propped up by the stimulus are going to start disappearing as early as this summer and early fall especially those that are driven by state or local spending. Absent increasing property tax revenues, sales tax revenues, etc. projects won't be funded for 2011 to take up the same number of workers. Teachers, and other workers in various government agencies will lose those jobs.
And now with the falling Euro, falling yen, and strengthening dollar the export trade that had been juicing the numbers will be impacted. Hopefully this will be temporary but it won't help in the short run.
A good number of the companies reporting higher earnings or higher profits (or both) have seen hefty contributions to those numbers coming from their overseas operations. In many cases this isn't a function of products manufactured here and shipped overseas. Those products are either produced there or in other overseas locations and shipped to the countries in question. So those numbers are not translating to jobs here in the United States.
While I hope that you are correct I can't help but wonder whether or not this current "recovery" is nothing more than extend and pretend at least past the November elections so that the administration, in theory, can buy themselves two more years to try to tackle the underlying problem with employment - the structural losses.
So much of the jobs lost were in areas that grew based on rampant speculation rather than fundamentals. Housing construction for one. Retail construction for another.
Those stores that were built during speculative expansions that are now closed (or other stores closed elsewhere in their stead) may never open again and along with them the jobs they supported. The net effect of some of those losses in so-called "boom towns" of a few years ago are going to leave thousands of people in those places faced with no local jobs.
You should, by now, be able to smell the downward wage arbitrage that is going to ensue as these people will have to compete with others elsewhere that already have jobs. We are seeing existing store sales rising above and beyond reported increased spending because most of the retail chains have closed stores over the last 3 years thus moving customers to existing stores, in turn, boosting the returns from those stores. At the same time they are moving nowhere near as much inventory as a whole as they had in the past. And the ratio of more customers to less stores allows the chains to maintain or even raise prices without significant cost in more product nor creating new jobs to service those customers.
So the key issue for the government is where are they going to find the jobs for the millions of structural jobs that have been lost. We haven't seen any sign of a plan for that - and "industry" isn't stepping up to the plate either. It doesn't bode well for the mid and long term unless something gives.
Mindrayge:
Of course I agree with you re wage arbitrage and the (bad) deflationary pressure on wages, and also the inability for consumers to lever up on debt as before, and on the need for government to step in.
A couple of things you might consider:
1. In re the Nonmanufacturing employment reading of 49.5 for April, if you click over to this graph by Calculated Risk shows that Non manufacturing employment index reading of about 47.5-48 and above typically coincide with services growth in nonfarm payrolls.
2. In re "this time it's different," people were making the same criticisms of my (and Bonddad's) "squiggly lines" 6, 9, and 12 months ago -- and yet the squiggly lines have continued to behave pretty much exactly as we said they would throughout that period. Nothing is certain, but I like the odds here.
The Gallup surveyed for unemployed
had
"Gallup's unemployment rate (not seasonally adjusted) declined to 9.7% in April from 10.4% in March"
The seasonal adjustment for the unemployment rate from March to April is usually .4.So..........7
minus .4 = .3.....Maybe a 9.4% SA
unemployment rate???
Post a Comment