Despite the way yesterday felt to many, the reality is yesterday's trade wasn't really that complicated. For the time period marked (a) we have a standard, disciplined, sell-off. Points b is where the fun kicks in. There were stories of a "fat finger" situation where somebody typed in billion instead of million on a Proctor and Gamble trade. This led to a computer trading feeding frenzy:
The glitch that sent markets tumbling Thursday was years in the making, driven by the rise of computers that transformed stock trading more in the last 20 years than in the previous 200.
The old system of floor traders matching buyers and sellers has been replaced by machines that process trades automatically, speeding the flow of buy and sell orders but also sometimes facilitating the kind of unexplained volatility that roiled markets Thursday.“We have a market that responds in milliseconds, but the humans monitoring respond in minutes, and unfortunately billions of dollars of damage can occur in the meantime,” said James Angel, a professor of finance at the McDonough School of Business at Georgetown University.
In recent years, what is known as high-frequency trading — rapid automated buying and selling — has taken off and now accounts for 50 to 75 percent of daily trading volume. At the same time, new electronic exchanges have taken over much of the volume that used to be handled by the New York Stock Exchange.
At (b) we have a major drop in the market on extreme volume. But notice that prices rebounded quickly at point c. Basically, the market made a round-trip through a crash in a period of about half an hour.
Speaking from a personal level, when I saw this happening, all I could think was "selling panic" which is the end move in a big move down. Obviously someone else was too -- the parties that purchased at point c.
As a result of all the market volatility, safe assets caught a major bid.
Gold gapped higher at the open (a), then rode the EMAs higher for the rest of the day (b). Also notice the higher volume (c) throughout the day.
The Treasury market also continues its massive rally (a) on very high volume (b). Also note the EMA picture remains very bullish with the shorter EMAs moving higher and prices above the 200 day EMA. I still consider this trade an anomily in the market -- that is, a short term abberation to a longer term trend.
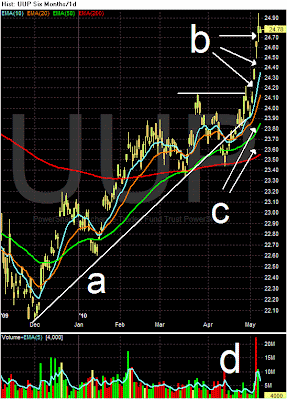
The dollar is still catching safety bid at the euros expense. The primary uptrend (a) is still intact. Prices have gapped higher (b) on very strong volume (d). This might be an exhaustion gap -- a gap that occurs at the end of a long upward trend on high volume. If this is an exhaustion gap, we'll know soon enough as they tend to close very quickly. Also note the EMA picture is bullish -- all the EMAs are moving higher, the shorter EMAs are above the longer EMAs and prices are above all the EMAs.


